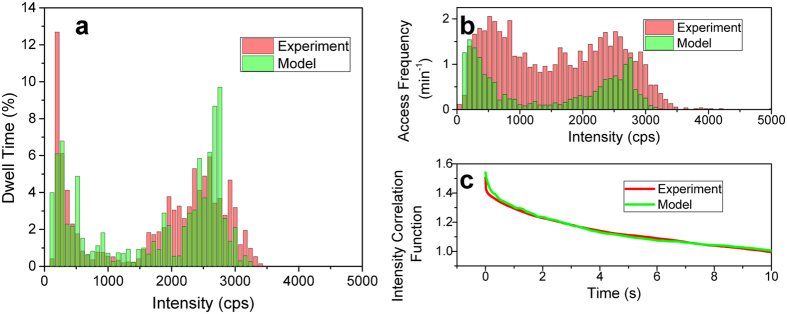
Figure 5. Experimental (red) and calcuated (green) intensity blinking statistics.
(a) The percentage of time the complexes dwelled on respective intensity levels. The two-state structure of the low-intensity OFF states and higher intensity ON states is apparent. (b) How often per minute the complexes accessed the respective intensity levels. The experimental frequency is higher due to switching within the ON/OFF states. (c) The intensity correlation function.

