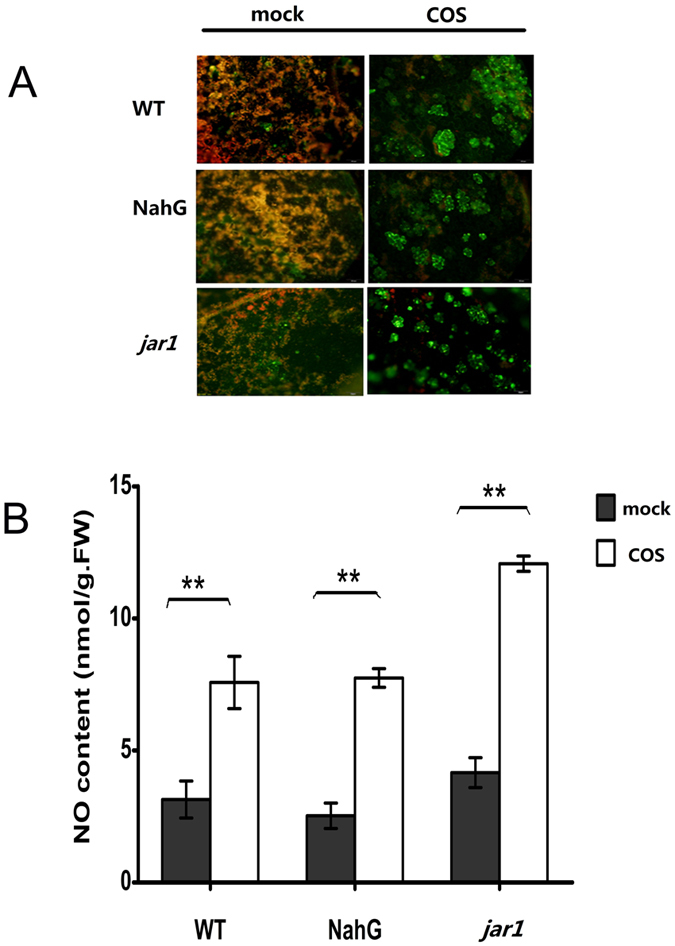
Figure 6. The NO production in rosette leaves of Arabidopsis.

(A) The NO production (green) in epidermal cells of different Arabidopsis mutants after COS treatment, observed by using fluorescence microscopy. (B) The NO content in rosette leaves measured by Griess reagent. Values are the means ± SD from three independent measurements. Asterisks indicate significant differences (**P < 0.01).
