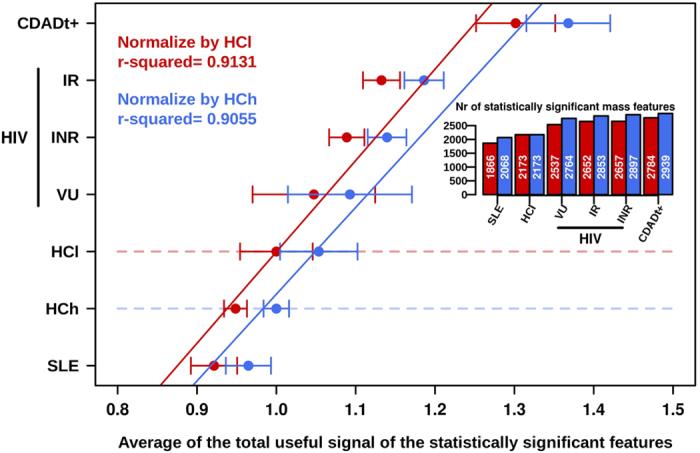
Figure 3. Dysbiosis ranking correlation plot based on the impact of the diseases on the gut microbial metabolome.

Quantifications based on the number of metabolites (shown in the inset) and the total useful signals (X axe) that were statistically (p < 0.05) altered in each disease (Y axe, arbitrary) versus HCl (in red) and HCh (in blue) are shown. Values represent the median ± range.
