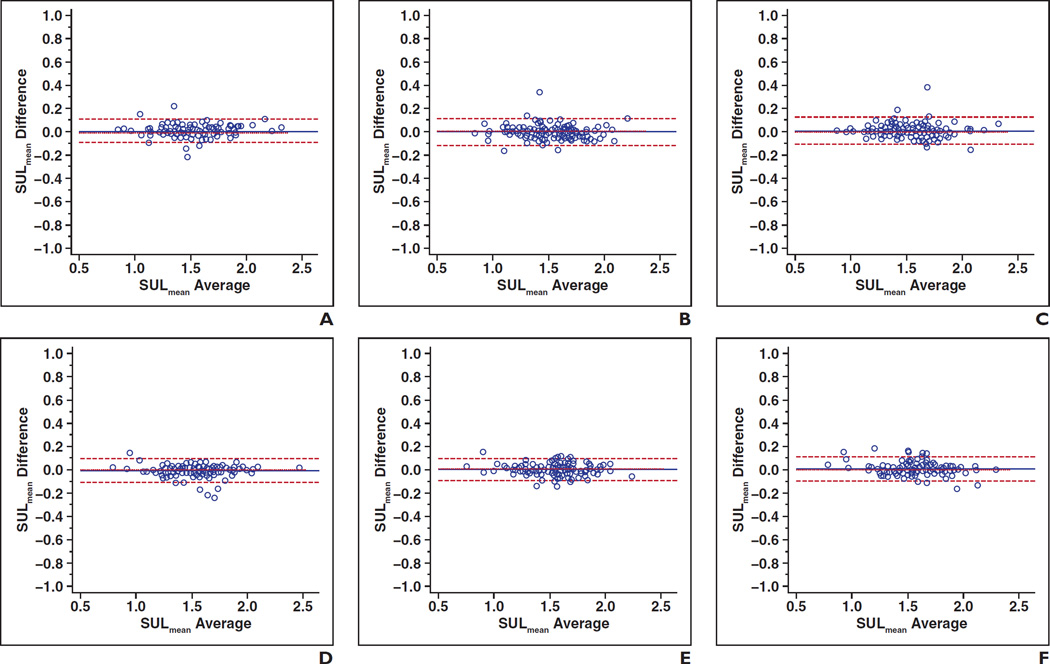
Fig. 2.
Bland-Altman plots show interreader agreement of liver mean standardized uptake value normalized to lean body mass (SULmean) controlling for time point and liver location.
A–C, Plots show first time point: upper liver (A) (intraclass coefficient [ICC] = 0.990), portal vein (B) (ICC = 0.987), and lower liver (C) (ICC = 0.986).
D–F, Plots show second time point: upper liver (D) (ICC = 0.990), portal vein (E) (ICC = 0.991), and lower liver (F) (ICC = 0.989).

