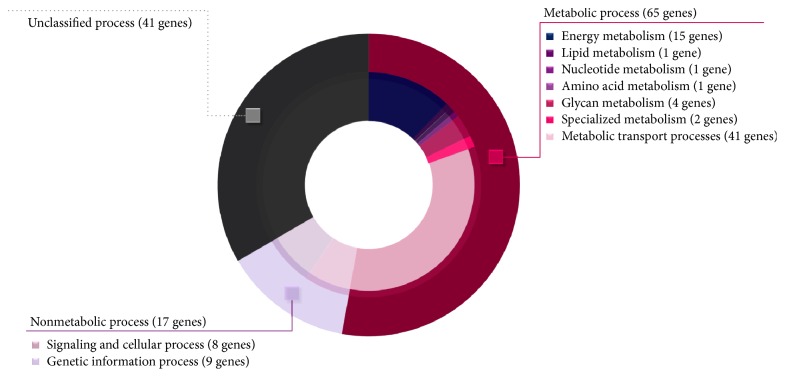
Figure 2.
Doughnut chart illustrates different functional categories of A. oryzae candidate transporter genes. Outer layer shows three main functional categories (i.e., metabolic, nonmetabolic, and unclassified processes). Inner layer shows seven subcategories distributed into metabolic process and two subcategories distributed into nonmetabolic process. Ring size reflects the relative ratio of genes identified in each category.

