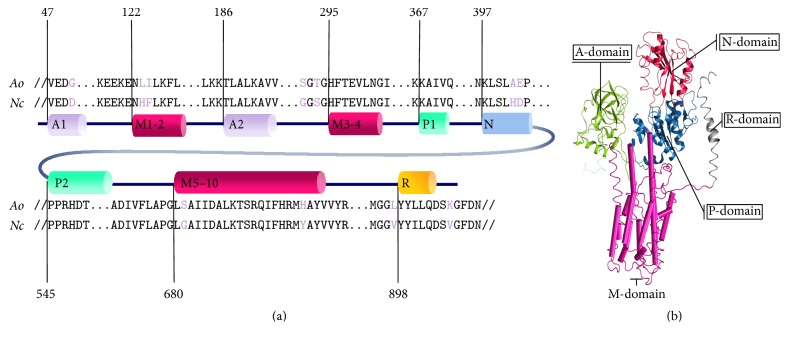
Figure 4.
Diagram shows sequence alignment between the H+-ATPase in A. oryzae (Ao) and N. crassa (Nc) (PDB ID: 1MHS) [30] in (a) and structural template with five principle domains distinguished with different colors in (b). For both (a) and (b), A1-2 indicates actuator (A) domain shaded in green, P1-2 indicates the phosphorylation (P) domain shaded in blue, N indicates the nucleotide-binding (N) domain shaded in red, M1-2, M3-4, and M5–10 indicate the transmembrane (M) domain shaded in pink, and R indicates the regulatory (R) domain of the H+-ATPase shaded in grey.

