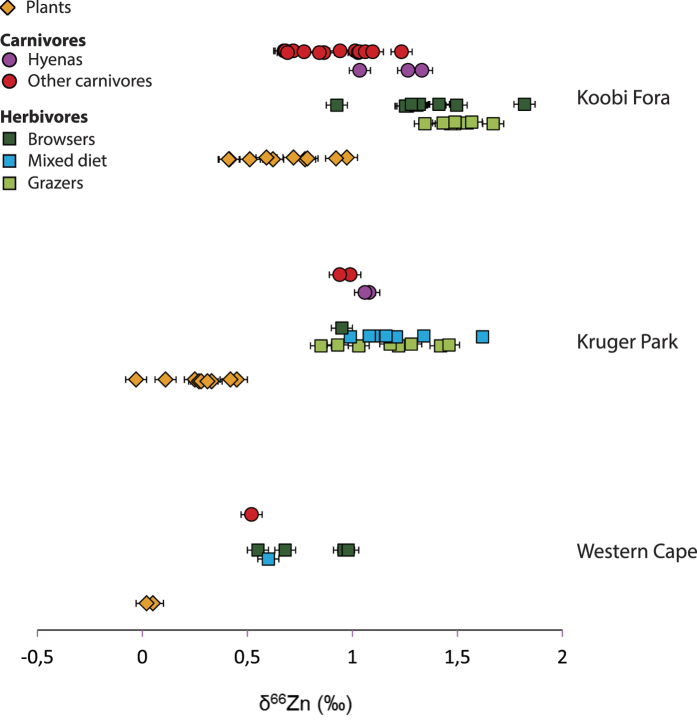
Figure 4. δ66Zn bone and plant values for three African trophic chains: Koobi Fora, Kenya (this study), Kruger Park (South Africa) and Western Cape (South Africa).
Note that plant isotopic compositions vary between sites. Hyenas show higher δ66Zn bone values than other carnivores. Error bars corresponds to one SD.

