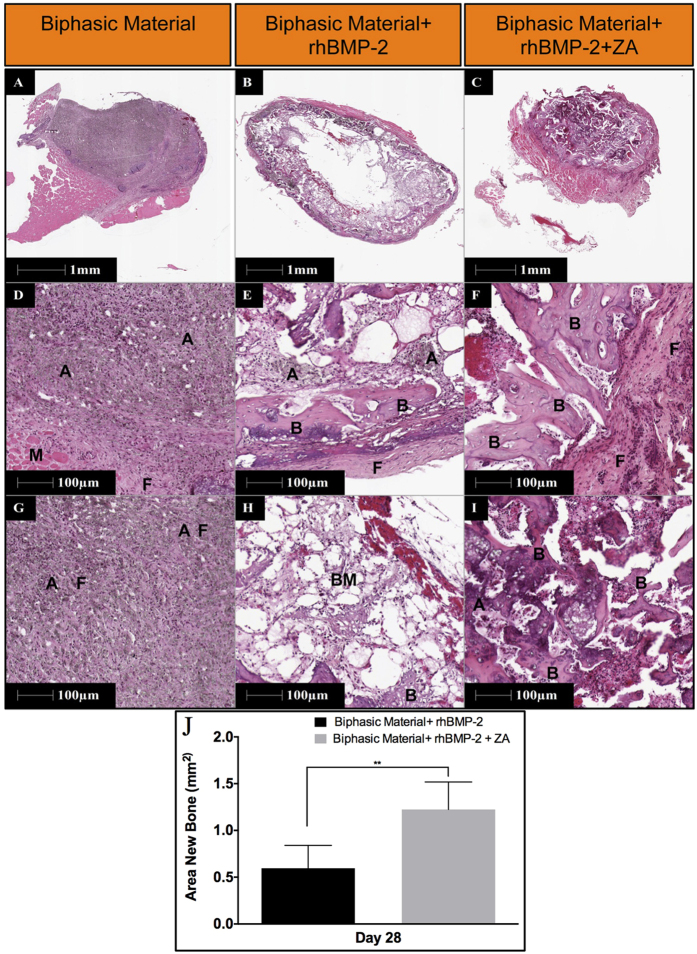
Figure 5. Histological representation and histomorphometric analysis of the samples implanted in the abdominal muscle pouch.
Images in top panels provide an overview of the whole sample (12.5X) in the three groups after 28-days of implantation. Images in the middle panel emphasizes on the periphery of the material/bone composite (100X) while images in the bottom panels indicate the innermost tissue/material construct (100X). A indicates apatite, B shows bone, F represents fibrous tissue and “BM” shows bone marrow. Data in (J) shows Histomorphometric quantification of bone area across the two groups with bone formation. Data is expressed as mean ± SD. n = 5.

