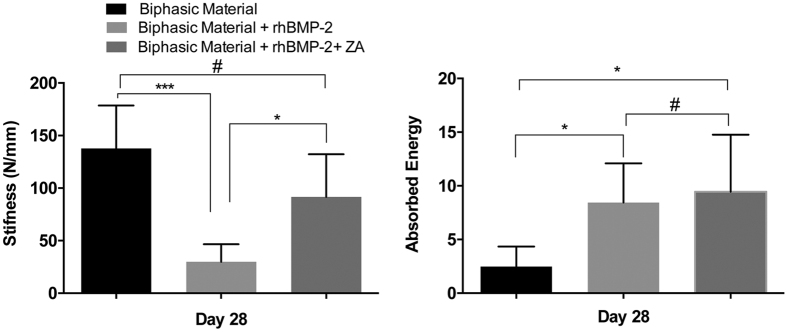
Figure 7. Mechanical testing of implanted samples after 28-days of in-vivo implantation.
Left panel shows the stiffness of the bone/material composite in the three groups while right panel indicates the absorbed energy across the three groups. *Indicates p < 0.05, ***p < 0.001, #indicates non-significant. Data is expressed as mean ± SD. n = 5.

