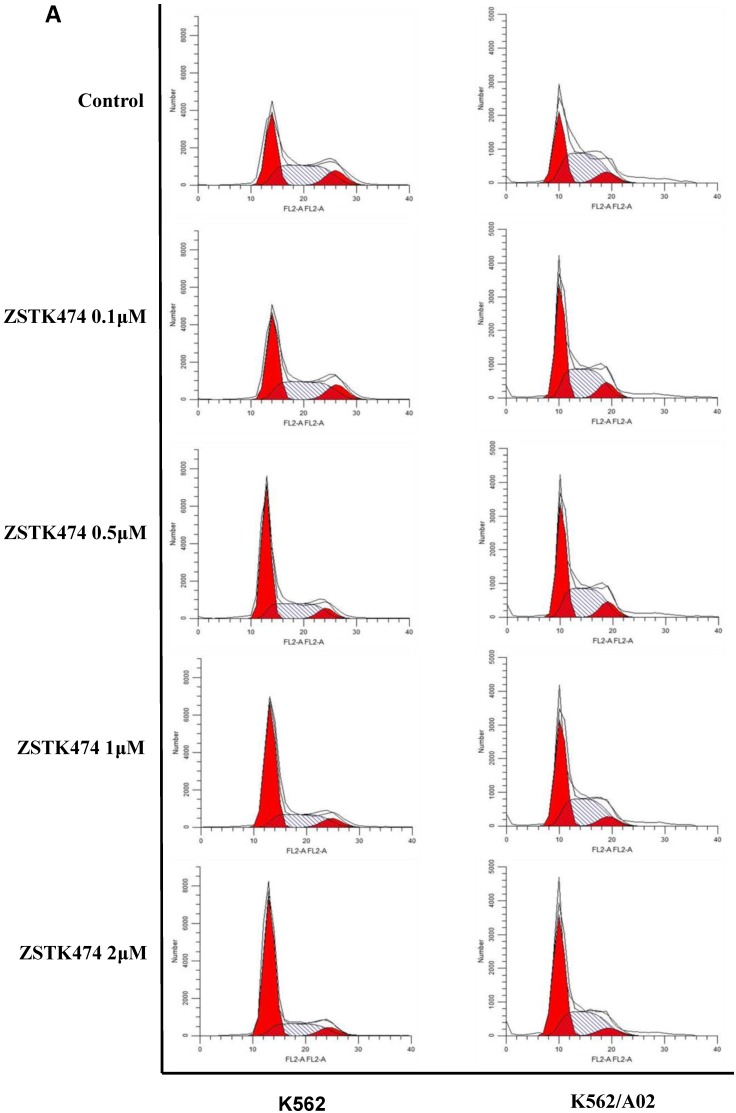
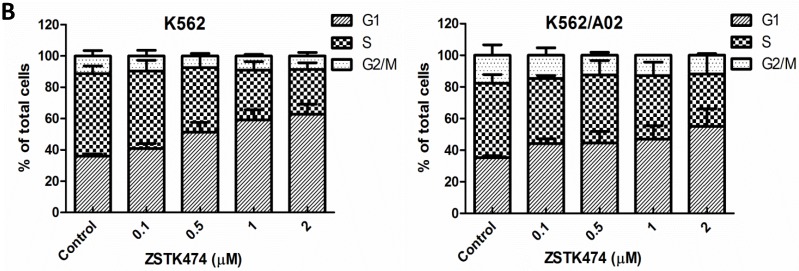
Figure 2.
ZSTK474 induced cell cycle arrest at G1 phase in K562 and K562/A02 cells. (A) Cell cycle distribution analysis by flow cytometer. K562 and K562/A02 cells were incubated with indicated concentrations of ZSTK474 for 48 h. The cells were harvested, stained with PI and analyzed by flow cytometer. Cell cycle distribution was further analyzed by Modfit software. (B) The percentage of total cells at G1, S, and G2/M phases. Data are mean ± SD, representative of three independent experiments.


