
Fig. 2.
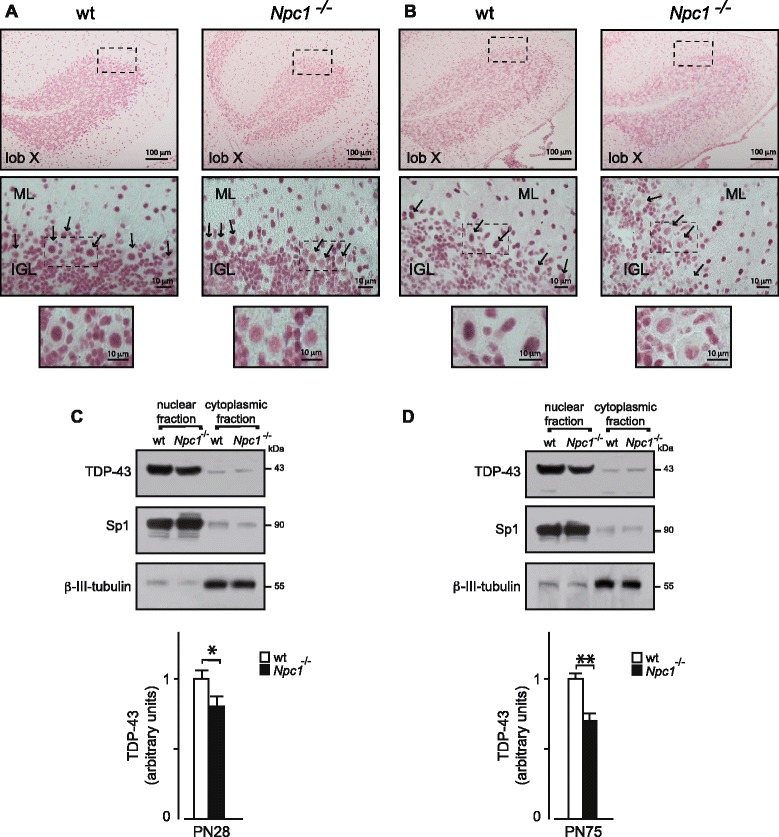
TDP-43 immunohistochemistry of cerebellum sections of wt and Npc1 −/− PN28 (a) and PN75 (b) mice. At higher magnification (bottom panels), immunohistochemistry revealed a decrease of TDP-43 nuclear expression in Purkinje cells (arrows) and GNs of Npc1 −/− compared to wt mice, which is particularly pronounced in PN75 mice. ML: molecular layer; IGL: inner granule layer. (c and d) Western blot analysis of TDP-43 protein levels in nuclear and cytoplasmic cerebellar fractions, identified by Sp1 and β-III-tubulin, respectively. Histograms indicate nuclear TDP-43 abundance (mean ± SEM), determined by densitometry of protein bands obtained in at least 3 independent experiments (having at least three replicates for each data point) taking the Sp1 as internal reference. * indicates P < 0.05 and ** indicates P < 0.01 in Student’s t-test