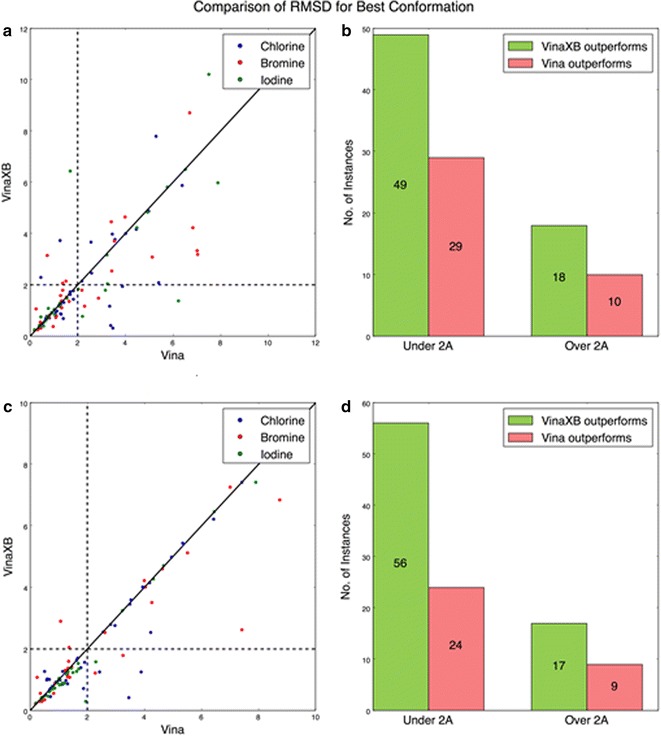
Fig. 6.

a Scatter plot comparison of RMSD values of the best conformations using Vina versus VinaXB at exhaustiveness 8. b Bar chart showing the number of instances in which Vina or VinaXB performed better than the other, when RMSD values are above and below 2 Å at exhaustiveness 8. c Scatter plot comparison of RMSD values of the best conformations using Vina versus VinaXB at exhaustiveness 100. d Bar chart showing the number of instances in which Vina or VinaXB performed better than the other, when RMSD values are above and below 2 Å at exhaustiveness 100
