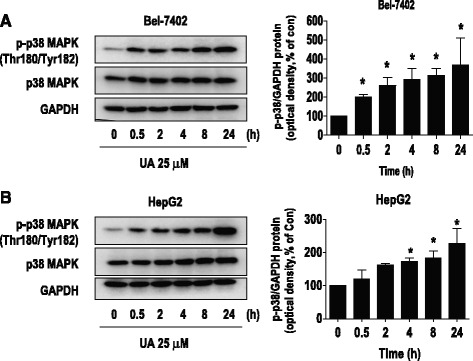
Fig. 2.

UA induced phosphorylation of p38 MAPK. a-b, Bel-7402 (a) and HepG2 (b) cells were exposed to UA (25 μM) for 24 h, followed by measuring the phosphorylation and protein expression of p38 MAPK by Western blot. The bar graphs represent the mean ± SD of p-p38 MAPK/GAPDH of three independent experiments. *Indicates significant difference as compared to the zero time group (P < 0.05)
