Fig. 2.

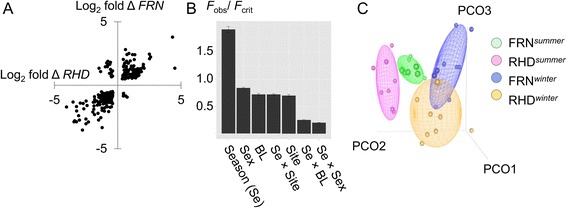
Extremes of season were the dominant predictor of immune gene expression. a Scatterplot of log2 winter-summer fold expression change (log2 fold Δ) for all immune-associated (ImmPort list) genes with significant seasonal difference (individual P < 0.05) at both RHD and FRN sites. Overwhelmingly such genes were regulated in the same direction across sites. b Season was overwhelmingly the most important predictor of immune gene expression, in comparison to site, sex and body size (analysis based on all ImmPort list genes, n = 3648). Bar chart summarizes results from general linear models (LMs) fitted to each individual log2 immune-associated gene expression variable; bars are the mean observed F value (± 1 SE) for each model term (BL, body length; Se, season), expressed as a proportion of the critical value (P = 0.05) and relate to models lacking interaction terms in the case of the main effects. c Principal co-ordinates (PCO) ordination of immune-associated gene expression (all ImmPort list genes), indicating strong divergence between summer and winter samples along similar site-specific trajectories; plot showing scatter of individual points against the 3 major axes (PCO-1-3) and concentration ellipsoids containing 50 % of points
