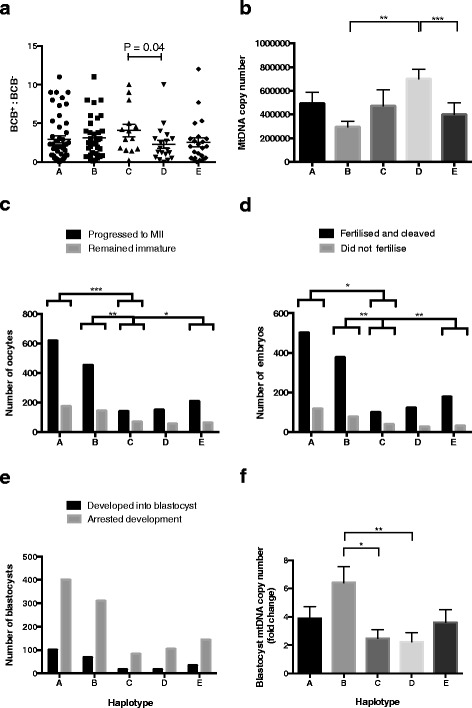
Fig. 3.

MtDNA haplotypes and developmental rates. a Ratios of developmentally competent COCs (mean ± SEM) determined by BCB staining. There were no overall differences between the haplotypes. However, haplotype C produced more developmentally competent COCs than D, determined by t-Test. b Mean (± SEM) mtDNA copy number for BCB+ oocytes. Differences were determined by Kruskal-Wallis test and Dunn’s multiple comparison test. c Progression of oocytes to metaphase II following IVM. Haplotypes were compared using Fisher’s exact test. d Fertilization rates following IVF. Haplotypes were compared using Fisher’s exact test. e Number of blastocysts following 7 days of culture. Haplotypes were compared using Fisher’s exact test. f MtDNA copy number fold increase (mean ± SEM) for metaphase II BCB+ oocytes to blastocyst. Differences were determined by Kruskal-Wallis test and Dunn’s multiple comparison test. *P < 0.05; **P < 0.01; ***P < 0.001
