
Fig. 7.
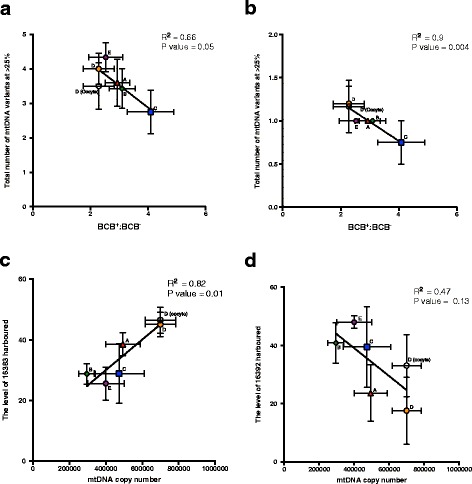
Correlations for mtDNA variants with the ratio of BCB+ to BCB− oocytes and mtDNA copy number determined by Pearson’s coefficient. Ear-tag tissue samples from haplotypes A to E are represented by red, green, blue, orange and purple shapes, respectively; open circle represents oocytes from haplotype D. a The number of variants harbored by mtDNA at a frequency of > 25 %. b Number of variants harbored by complex III (Cyt B) at a frequency > 25 %. c Level of variant harbored at position 16383. d Level of variant harbored at position 16392