Fig. 1.

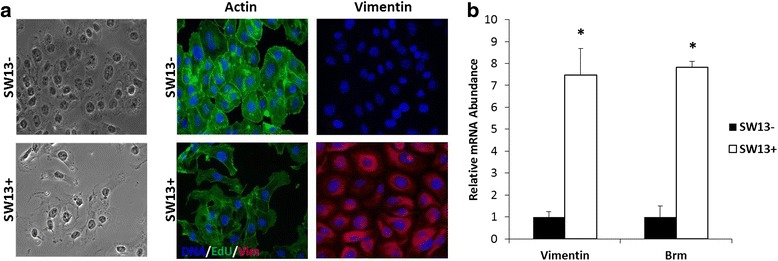
SW13- and SW13+ subtype characterization: differences in morphology, actin organization, vimentin expression, and VIM and BRM levels. a Subtypes have distinct morphology, actin organization, and levels of vimentin expression. Left-hand panel: light microscopy photographs; Middle panel: visualization of actin filaments with fluorescent phalloidin; Right-hand panel: expression of vimentin by immunofluorescence. Images were taken using a 40× oil-immersion objective lens. b qPCR reveals VIM and BRM mRNA expression is ~ 8 -fold higher in the SW13+ cells compared to the SW13- cells. Data are presented as mean ± SEM. *Denotes statistical difference between subtypes, p <0.05
