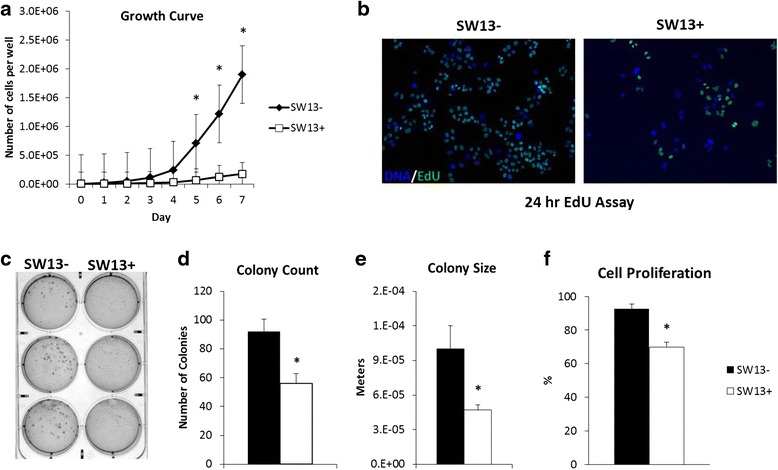
Fig. 2.

SW13- cells are more proliferative and have higher rates of anchorage independent growth than SW13+. SW13- and SW13+ cells were seeded in 6-well plates at 1 × 10⁴ cells per well and counted using a hemocytometer and trypan exclusion every 24 h for 7 days. a The growth rate of SW13- cells is significantly higher than SW13+ cells. b SW13- cells have higher rates of proliferation as determined by the higher number of EdU positive cells (green) per total number of cells indicated by Hoechst 33342 staining (blue). Images were taken using a 10× objective lens and quantitated (f) using ImageJ software. c Soft agar colony formation assays revealed SW13- cells exhibit increased rates of anchorage independent growth as indicated by (d) increased colony number and (e) increased colony size. Data are presented as mean ± SEM. *Denotes statistical difference between subtypes, p <0.05
