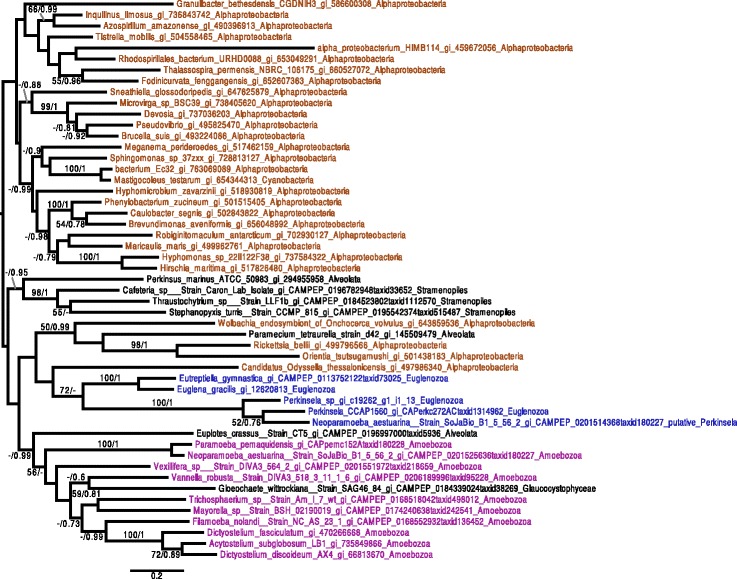
Fig. 4.

ALAS phylogenetic tree. The tree shown is the consensus tree obtained with Phylobayes 4.1 with ML boostrap values (left) and bayesian posterior probabilities (right) mapped onto the nodes. Bootstrap values >50 % are shown, while only posterior probabilities >0.6 are shown. Groups are color-coded according to taxonomy: Amoebozoa are in purple, Euglenozoa are in blue, other Eukaryota are in black, and Bacteria are brown. In this tree the Prokinetoplastina sequences branch together with Euglena gracilis and Eutreptiella gymnastica with a bootstrap value of 72 %. The scale bar shows the inferred number of amino acid substitutions per site
