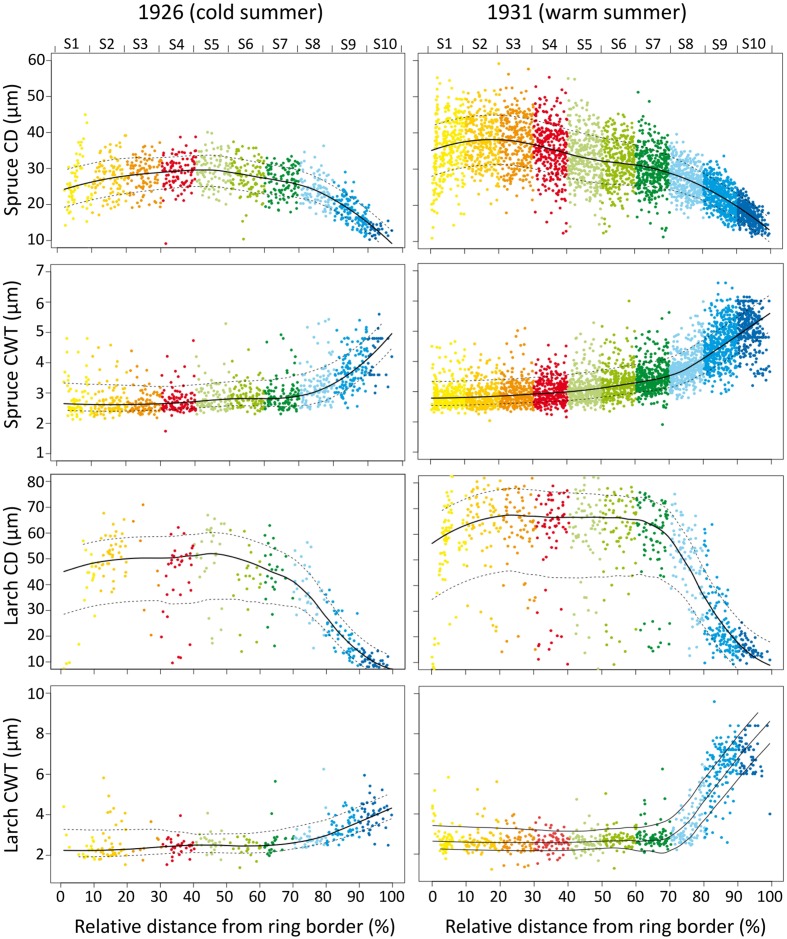
FIGURE 1.
Tree-ring anatomical profiles during a cold (1926, the first year with an extreme cold June in the 1926–2011 period) and a warm (1931, the first year with an extreme warm June in the 1926–2011 period) year in a spruce (PA04) and a larch (LD04) tree. X-axis represents the relative distance from the ring border, and the corresponding sector (upper axis and different colors). Dots are individual cell values, solid and dotted lines represent the mean and standard deviation values. Note different Y-axis scales for the four anatomical traits.

