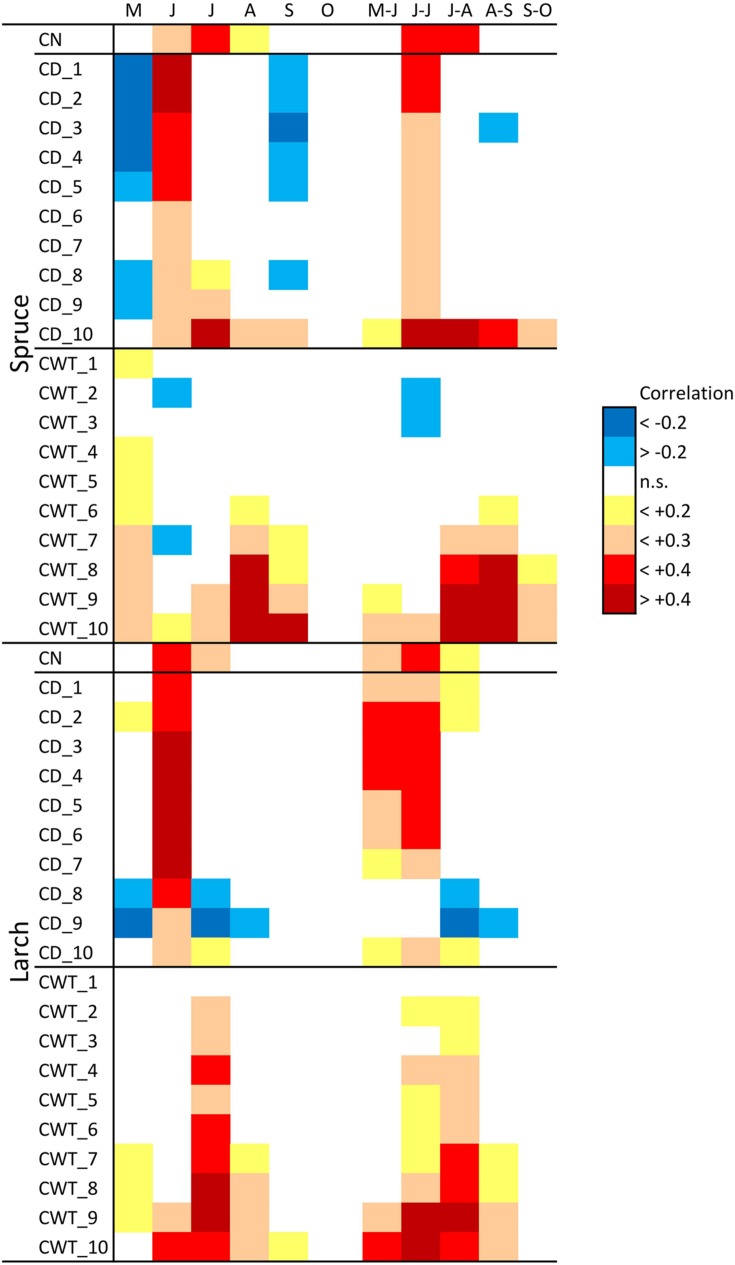
FIGURE 3.
Correlation between monthly (May–October) and bi-monthly (May–June to September–October) temperature during 1800–2011 and cell number (CN) chronologies, cell diameter (CD), and cell wall thickness (CWT) sector chronologies, in spruce and larch. Correlation values are coded according to the chromatic scale on the right.

