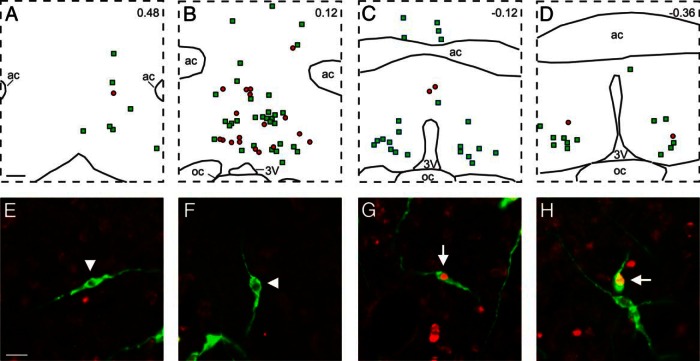
Figure 7.
A–D, Computer-assisted maps of GnRH (green squares) and GnRH/Fos (red circles) neurons in a Blank-SAP rat. The distance from bregma is indicated in upper right corners. E–H, Fluorescent photomicrographs of GnRH (green) and Fos (red) immunoreactivity. E and F show single-labeled GnRH neurons (arrowheads), and G and H show green GnRH neurons with red nuclear staining for Fos neurons (arrows). Although the LH surge was markedly amplified in KNDy-ablated rats, there was no change in number of neurons expressing GnRH or GnRH/Fos between Blank-SAP and NK3-SAP rats (Table 2). 3V, third ventricle; ac, anterior commissure; oc, optic chiasm. Scale bars, 250 μm (in A; applies to A–D) and 20 μm (in E; applies to E–H).

