Figure 1.
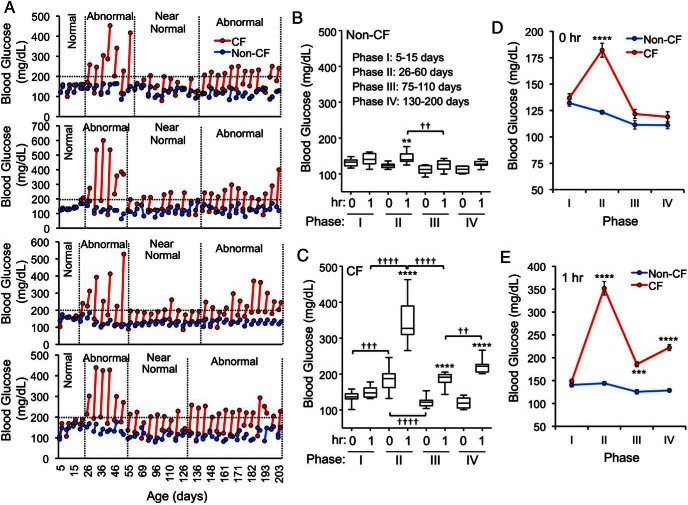
Phase-dependent glucose abnormalities in CFTR knockout ferrets after feeding. A, Blood glucose values before and 1 hour after feeding for 4 paired CF and non-CF ferrets. Each line connects the 2 glucose values at a given age. B and C, Average blood glucose values before and 1 hour after feeding for (B) non-CF and (C) CF ferrets at each of the indicated age ranges (“phases”). Blood glucose was measured every 5 days and the average of multiple measures for each animal within each age range were used to calculate means and error in each group. D, Baseline blood glucose (0 h) before feeding for the dataset in B and C. E, Blood glucose at 1 hour after feeding for the dataset in B and C. Between 7 and 13 independent animals were evaluated for each genotype and phase. The mean ± SEM are presented in D and E. Statistical analysis was performed by one-way ANOVA and a Newman-Keuls multiple comparison; B and C, Asterisks mark comparisons between 0 and 1 hour and daggers mark bracketed comparisons between phases with P values as †† or **, P < .01; ††† or ***, P < .001; †††† or ****, P < .0001. D and E, Asterisks mark genotypic comparisons within a single phases with ***, P < .001; ****, P < .0001.

