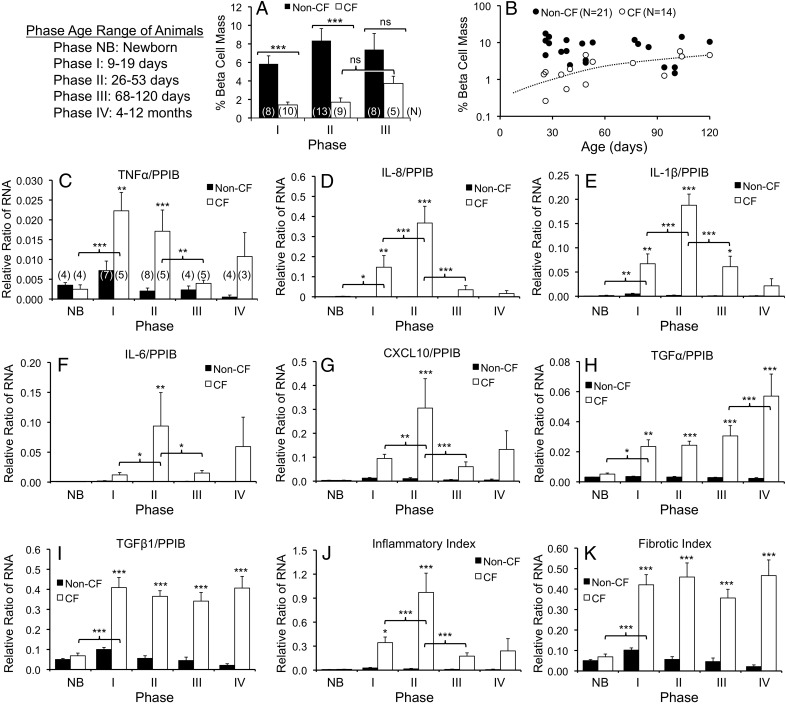
Figure 3.
Age-dependent changes in β-cell mass and pancreatic proinflammatory cytokine and chemokine gene expression. A, Morphometric analysis of β-cell mass expressed as the % pancreatic parenchymal immunostaining positive for insulin. There were significant differences by Mann-Whitney U test (***, P < .001; ns, not significant). Statistical comparisons for β-cell mass between newborn non-CF (7.6 ± 0.7%, N = 22) and CF (6.3 ± 0.8%, N=12) animals and phase I animals utilized previously published data and the same method for morphometry (8). In this comparison, β-cell mass of newborn CF animals and phase I CF animals was significantly different (P < .001). The results present the mean ± SEM, and the number of independent animals in each group as marked in brackets on the bar graph. B, There was a significant positive correlation between β-cell mass and age in CF animals by Pearson's correlation test (P = .0053, r = 0.7003) and a lack of correlation in non-CF. C–K, Lysates of CF and non-CF pancreata were used for detection of proinflammatory cytokine and chemokine RNA transcripts. Each sample was evaluated simultaneously for the RNA expression of the target genes and the housekeeping gene PPIB. C–I, The ratios of RNA transcript abundance for (C) TNFα to PPIB, (D) IL-8 to PPIB, (E) IL-1β to PPIB, (F) IL-6 to PPIB, (G) CXCL10 to PPIB, (H) TGFα to PPIB, and (I) TGFβ1 to PPIB for the various age ranges shown. J, The sum of proinflammatory RNA to PPIB RNA ratios for TNFα, IL-8, IL-1, IL-6, and CXCL10 was used to create an inflammatory index. K, The sum of TGFα to PPIB and TGFβ1 to PPIB RNA ratios were used to create a fibrotic index. Results in C–K show the mean ± SEM with significant differences by one-way ANOVA and Bonferroni post hoc test for the marked genotypic comparisons or within a genotype when marked by brackets: *, P < .05; **, P < .01; ***, P < .001. The number of independent animals in each group of (C–K) is indicated in brackets on the bar graph in C.

