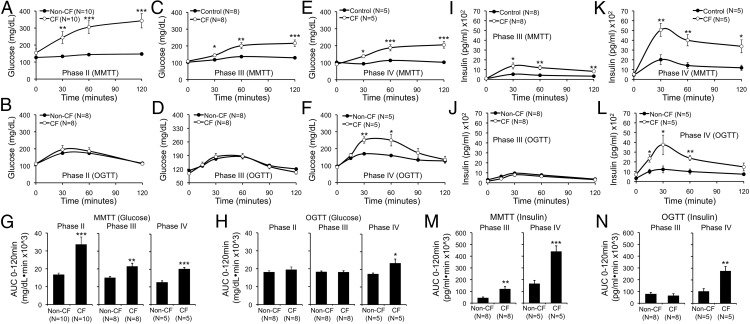
Figure 4.
Differential detection of abnormal glucose tolerance in CF ferrets following MMTT vs OGTT. A–F, Blood glucose during (A, C, and E) MMTTs or (B, D, and F) OGTTs on fasted paired CF and non-CF ferrets at the indicated phases (phase II, 1–2 mo; phase III, 2–4 mo; phase IV, 4–12 mo). G and H, Area under the curve (0–120 min) for glucose during MMTT and OGTT for data in A–F. I–L, Plasma insulin during (I and K) MTTT and (J and L) OGTT for the tests shown in C–F. M and N, Area under the curve analysis (0–120 min) for insulin during MMTT and OGTT for data in I–L. Results show the mean ± SEM with significant differences for marked comparisons between genotypes by 2-tailed Student's t test: *, P < .05; **, P < .01; ***, P < .001.

