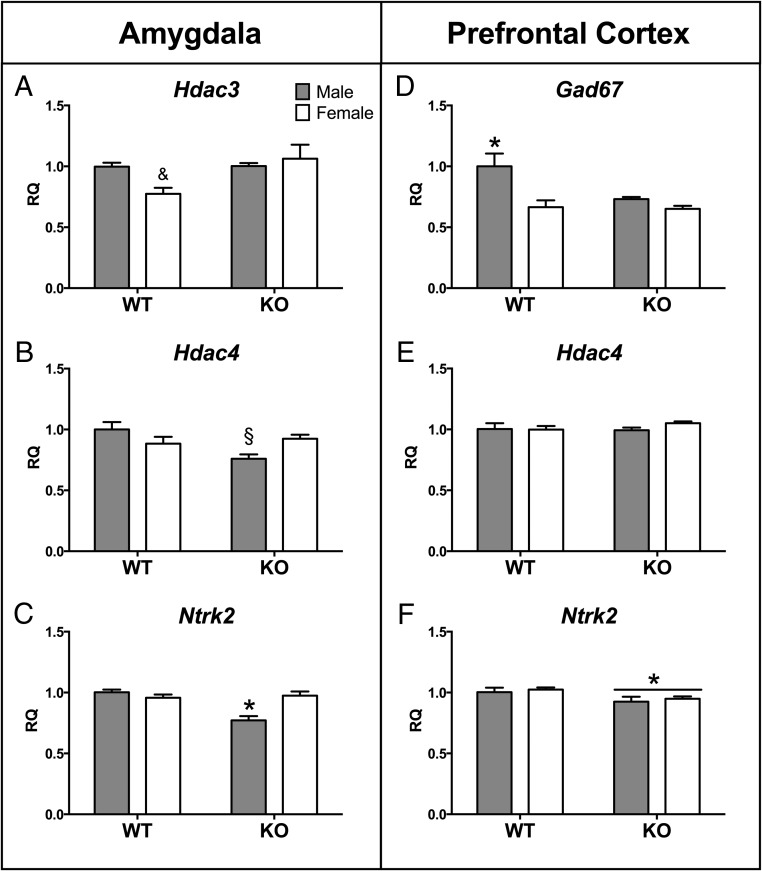
Figure 6.
Genotype-dependent expression changes in amygdala and PFC. Mean ± SEM relative quantity (RQ) values for expression of histone deacetylase 3 (Hdac3) in the amygdala (A); histone deacetylase 4 (Hdac4) in the amygdala (B) and PFC (E); neurotrophic tyrosine kinase receptor 2 (Ntrk2) in the amygdala (C) and in PFC (F). &, Trend for a sex-by-genotype interaction: female knockout greater than female wild type (P = .06); §, significantly different from same-sex control group (P < .05); *, significantly different from all other groups (P < .05).

