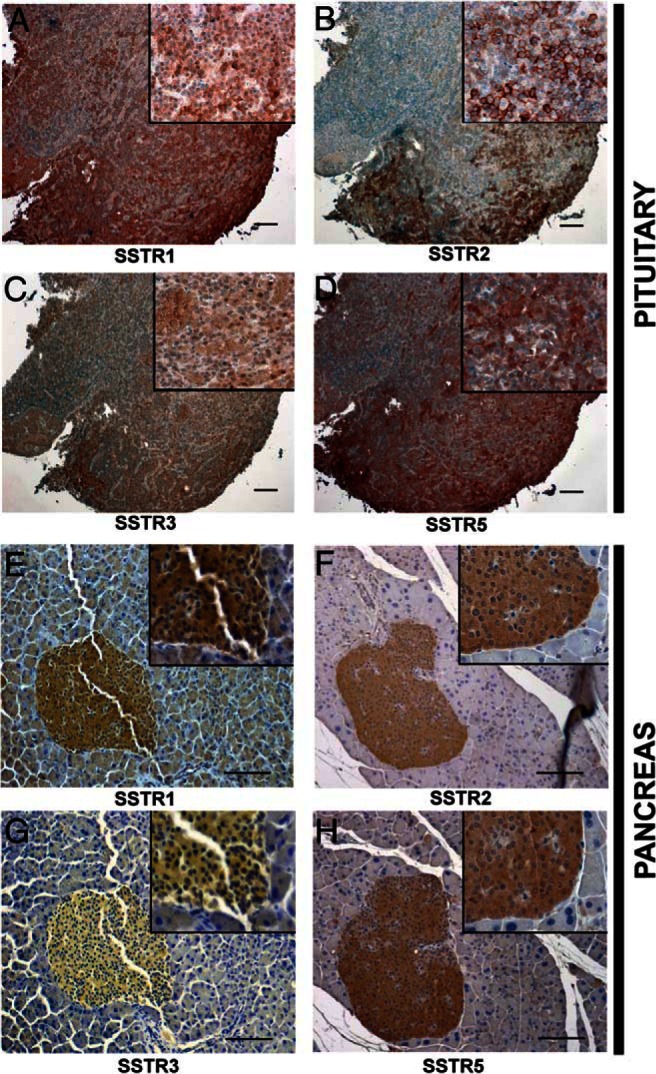
Figure 2.

Immunohistochemical analysis of SSTR expression in pituitary and pancreatic NETs. A–D, pituitary NETs; and E-H, pancreatic NETs. A, Pituitary NET showing diffuse cytoplasmic SSTR1 staining in a large number of cells. B, Pituitary NET showing moderate SSTR2 staining of the plasma membrane in a subset of cells. C, Pituitary NET showing diffuse cytoplasmic SSTR3 staining in a minority of cells. D, Pituitary NET showing moderate cytoplasmic SSTR5 staining in a large number of cells. E, Pancreatic NET showing cytoplasmic SSTR1 staining. F, Pancreatic NET showing cytoplasmic SSTR2 staining. G, Pancreatic NET showing absence of SSTR3 staining. H, Pancreatic NET showing cytoplasmic SSTR5 staining in most islet cells. Thus, pituitary NETs show expression of SSTR1, 2, 3, and 5, whereas pancreatic NETs show expression of only SSTR1, 2, and 5. Magnification 100× for pituitary NETs and 200x for pancreatic NETs; inset magnification 400× for pituitary and pancreatic NETs. Scale bar = 100 μm.
