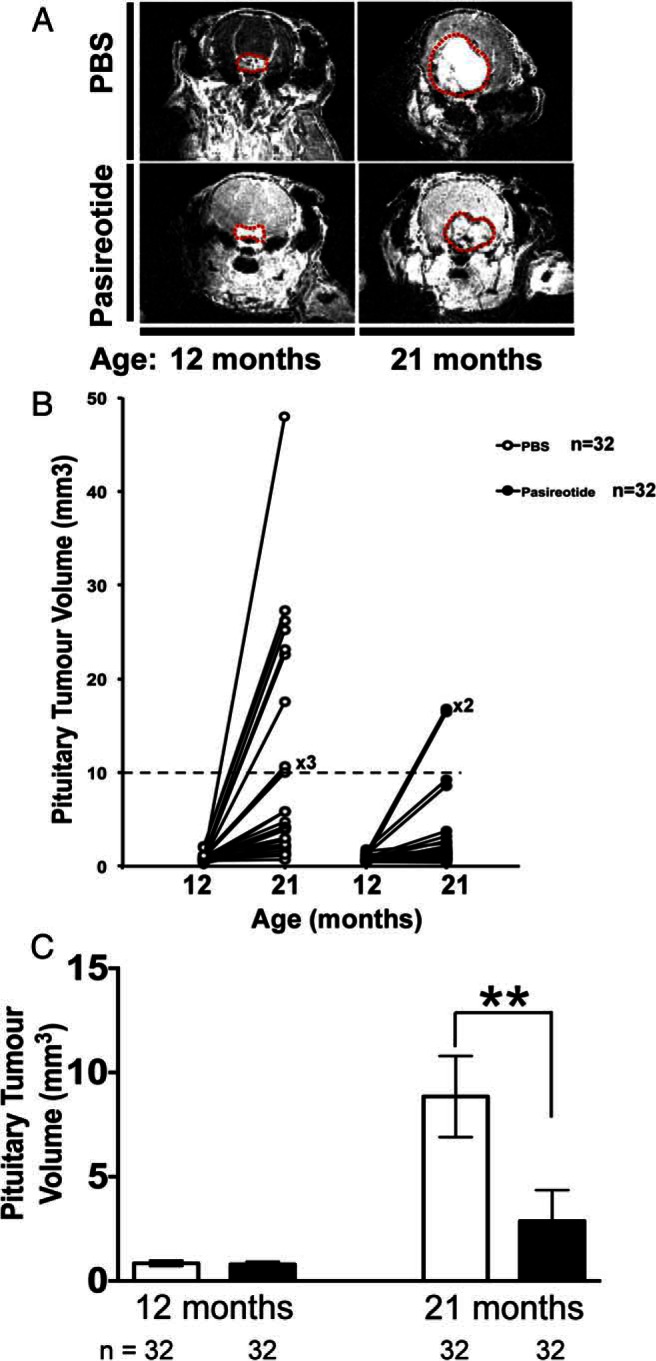
Figure 4.

Pituitary NET imaging and volumetric measurements. A, Cranial MRI with gadolinium enhancement demonstrating pituitary NETs (outlined in red dotted line) in a PBS-treated (upper panels) Men1+/− mouse and a pasireotide-treated (lower panels) Men1+/− mouse at age 12 and 21 mo. B, MRI was used to assess pituitary NET volumes, pretreatment (12 mo) and 9 mo post-treatment (21 mo). The PBS-treated Men1+/− mice (n = 32) and pasireotide-treated Men1+/− mice (n = 32) had similarly sized pituitary NETs of approximately 0.3–3.0 mm3 at age 12 mo (baseline). However by age 21 mo, 10 of 32 of PBS-treated Men1+/− mice (31%) had developed large pituitary NETs of at least 10 mm3, whereas only two of 32 of Men1+/− mice (6.3%) treated with pasireotide had developed pituitary NETs with volumes at least 10 mm3. There was no evidence of pituitary NET development in the remaining 15 of 47 PBS-treated Men1+/− mice (31.9%) or 19 of pasireotide-treated Men1+/− mice 51 (37.3%) at age 21 mo, consistent with our previous observation that pituitary NETs only develop in a subset of female Men1+/− mice (29). C, The mean pituitary NET volumes at 12 mo in the PBS-treated (open bars) (n = 32) and pasireotide-treated (filled bars) (n = 32) Men1+/− mice were not significantly different (mean volume ± SEM of PBS-treated, 0.844 ± 0.066 mm3 vs pasireotide-treated, 0.803 ± 0.058 mm3). However, after 9 mo of treatment, at the age of 21 mo, the pasireotide-treated mice (n = 32) had a significantly smaller increase in pituitary NET volume when compared with the PBS-treated Men1+/− mice, such that the mean ± SEM pituitary tumor volume of the pasireotide-treated Men1+/− mice was 2.872 ± 0.728 mm3 compared with 8.847 ± 1.948 mm3 of the PBS-treated Men1+/− mice (**, P < .01). Error bars represent SEM.
