Figure 3.
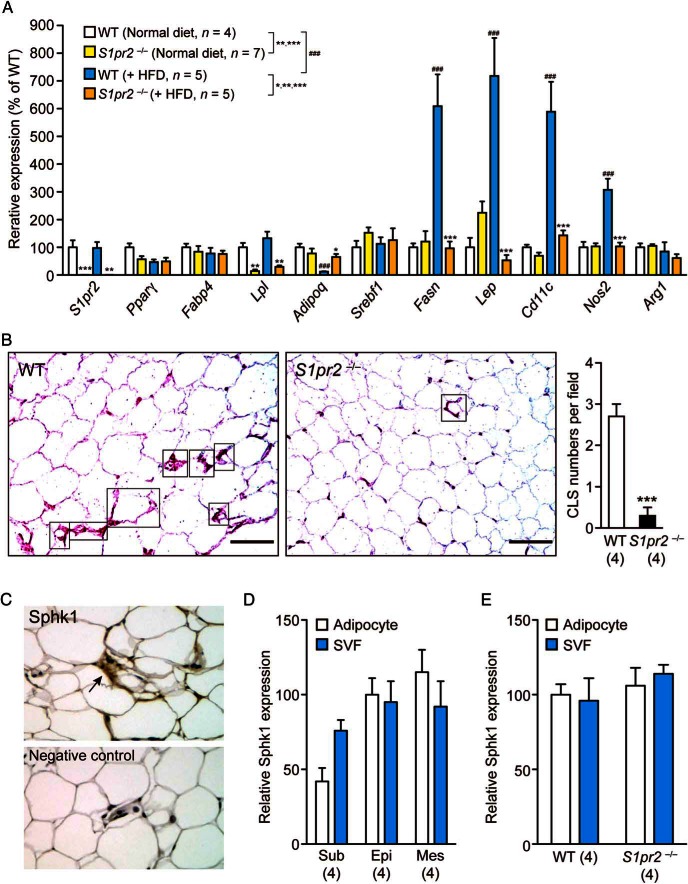
HFD-induced inflammation of epididymal adipocytes is attenuated in S1pr2−/− mice. A, Expression levels of various adipocyte-specific genes in the epididymal fat tissues of HFD-fed WT and S1pr2−/− mice. Data are mean ± SEM; *, P < .05; **, P < .01; and ***, P < .001 vs WT samples; and ###, P < .001 vs normal diet-fed samples (t test). B, Distribution of CLSs (indicated by rectangles) identified by Cd11c staining. (purple). The number of CLSs (in which at least two-thirds of the cell periphery was stained with Cd11c) per microscopic field was counted. Data are mean ± SEM (n, sample numbers); ***, P < .001 (t test). Scale bar, 50 μm. C, Representative image of Sphk1 staining of epididymal fat tissues in WT mice. A negative control (no Sphk1 antibody) image is attached. D, Sphk1 expression levels in isolated adipocyte fraction and SVF of sc (Sub), epididymal (Epi), and mesenteric (Mes) fat cells isolated from WT mice. E, Sphk1 expression levels in epididymal adipocytes and SVF isolated from WT and S1pr2−/− mice. Data are mean ± SEM (n, sample numbers); no significant difference was observed in D and E.

