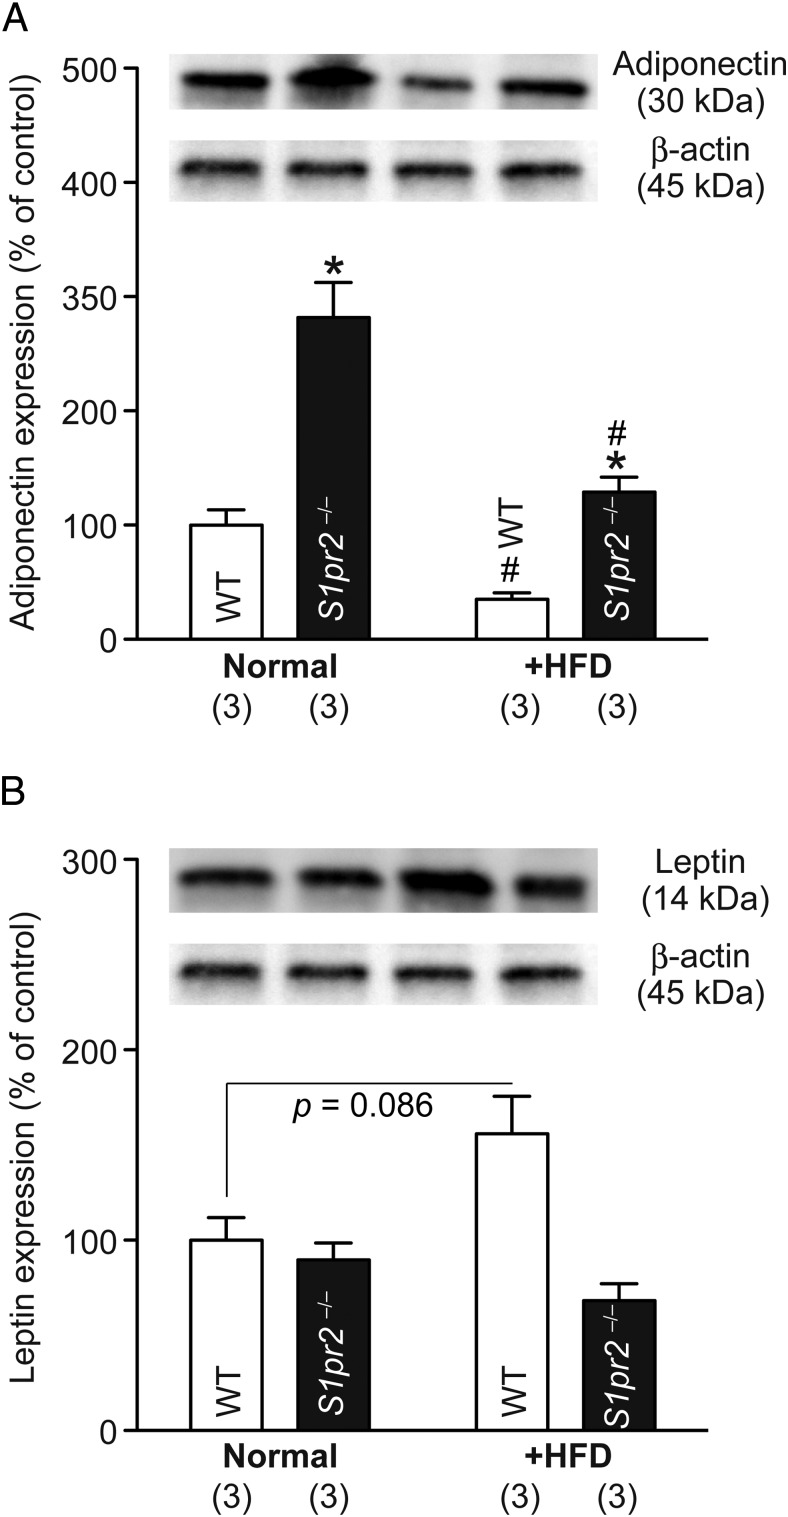
Figure 4.
Higher adiponectin expression and lower leptin expression in epididymal adipocytes of HFD-fed S1pr2−/− mice compared with HFD-fed WT mice. Expression of adiponectin (A) and leptin (B) was examined by Western blot analysis in epididymal adipocytes of normal diet/HFD-fed WT and S1pr2−/− mice. The average of expression relative to β-actin levels in normal diet-fed WT mice was set as 100%. Data are mean ± SEM (n, sample numbers); *, P < .05 vs WT samples; and #, P < .05 vs normal diet-fed samples (t test). The representative picture data are shown in the inset.

