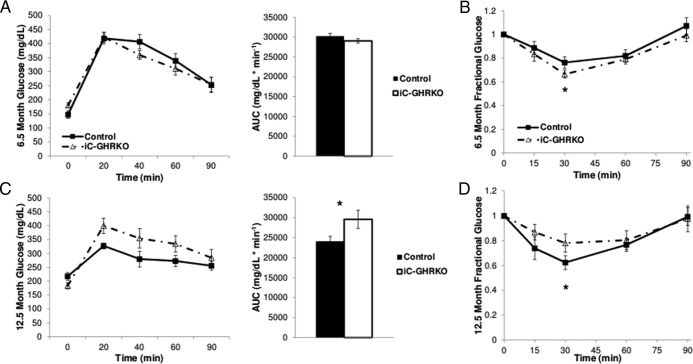
Figure 3.
Insulin and glucose tolerance testing. IGTT was performed in 6.5-month-old (A) and 12.5-month-old (C) iC-GHRKO (n = 8) and control littermates (n = 24) after a 12-hour fast and an injection of 10 μL/g body weight of a 10% glucose solution. Area under the curve of the glucose tolerance testing was calculated for both groups. Intraperitoneal ITT was performed in 6.5-month-old (B) and 12.5-month-old (D) nonfasted iC-GHRKO (n = 8) and control littermates (n = 24) after an injection of 1 U/kg body weight insulin. *, Significant difference between genotypes (P < .05). AUC, area under curve.

