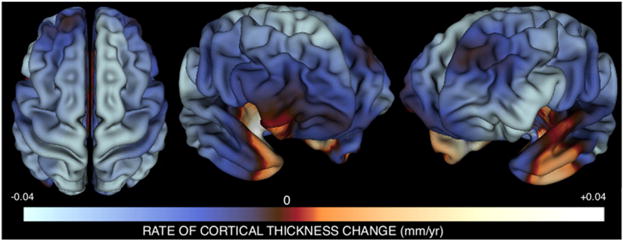
Figure 1. Mapping the Mean Rate of CT Change per Year between Ages 9 and 22 Years using Person-Specific Estimates of CT Change.

Three views of the cortical sheet are shown. Colors represent the magnitude of mean annual cortical thickness (CT) change within our sample at each vertex. Mean change values were derived by averaging estimates of weighted annual CT change across all participants. Over the age range studied, most cortical regions are becoming thinner with advancing age, with the exception of bilateral anterior-medial temporal and right orbitofrontal cortices where CT is still increasing with age. This approach to mapping annual CT change closely replicates results derived using traditional mixed-model approaches for analyzing longitudinal data (Figure S1), and converges with other larger mixed-model studies of CT change (Shaw et al., 2008), but has the added advantage of permitting correlational analysis of interindividual differences in CT change at different vertices.
