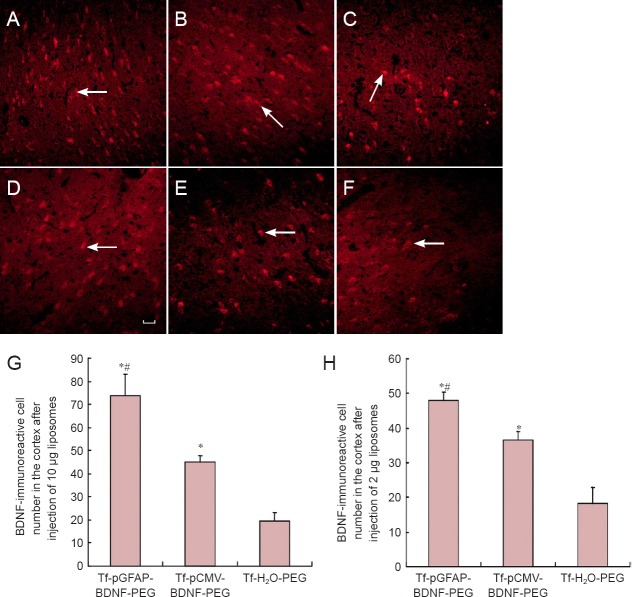
Figure 2.
Comparison of BDNF-immunoreactive cells in the cerebral cortex after tail-vein injection of different liposomes at high and low doses (immunofluorescence staining).
(A–F) BDNF-immunoreactive cells (arrows) in the cortex at 10 μg (A–C) and 2 μg (D–F). (A, D) Tf-pGFAP-BDNF-PEG; (B, F) Tf-pCMVBDNF-PEG; (C, F) Tf-H2O-PEG. (G, H) Number of BDNF-immunoreactive cells in the cortex after injection of 10 μg (G) and 2 μg (H) liposomes. Red-stained cells (arrows) are BDNF-immunoreactive and labeled with Cy5. *P < 0.05, vs. Tf-H2O-PEG; #P < 0.05, vs. Tf-pCMV-BDNF-PEG. Data are presented as the mean ± SD (10 rats per group; one-way analysis of variance followed by the least significant difference t-test). Scale bar: 50 μm. BDNF: Brain-derived neurotrophic factor; Tf: transferrin; pGFAP: glial fibrillary acidic protein promoter; PEG: polyethylene glycol; pCMV: cytomegalovirus promoter.

