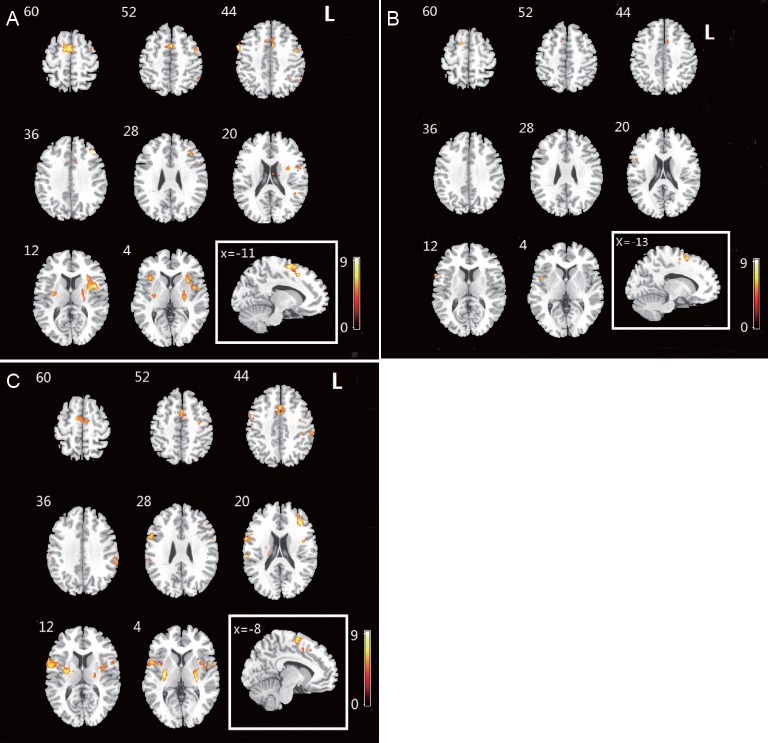
Figure 1.
Activation map of brain regions in control and patient groups during imagery grasping task.
(A) Activated brain regions in the control group. (B) Activated brain regions in the patient group on the affected side. (C) Activated brain regions in the patient group on the healthy side. The imaginary movement of the right hand generated activation in bilateral supplementary motor areas, right insula and inferior frontal lobe. The warm color bar is used to define the activation of the voxels. The red-yellow color suggests a positive activation in the brain area. The numbers in the figures correspond to the slice numbers in the CH2 brain template. L: Left.

