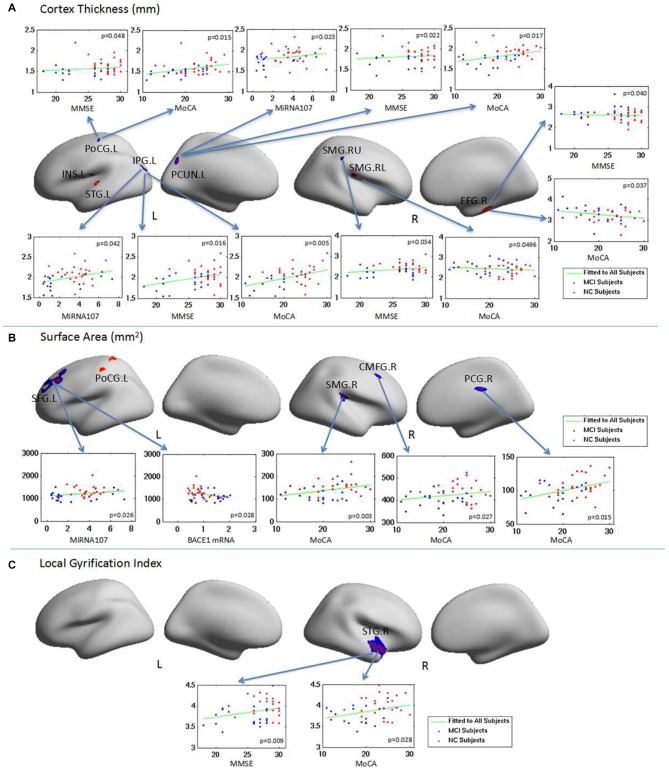
Figure 4.
The relationship between brain regions with abnormal surface anatomy in aMCI and neuropsychological test scores and the plasma target gene expressions. Changes in CT, SA and LGI in aMCI were correlated with neuropsychological scores and/or plasma MiRNA 107 expression. (A) The relationship of CT with neuropsycological test score and the plasma expression of MiRNA 107. (B) The relationship of SA with neuropsycological test score and the plasma expression of MiRNA 107 and BACE1 mRNA. (C) The relationship of local gyrification and neuropsycological test score.

