
Fig. 1.
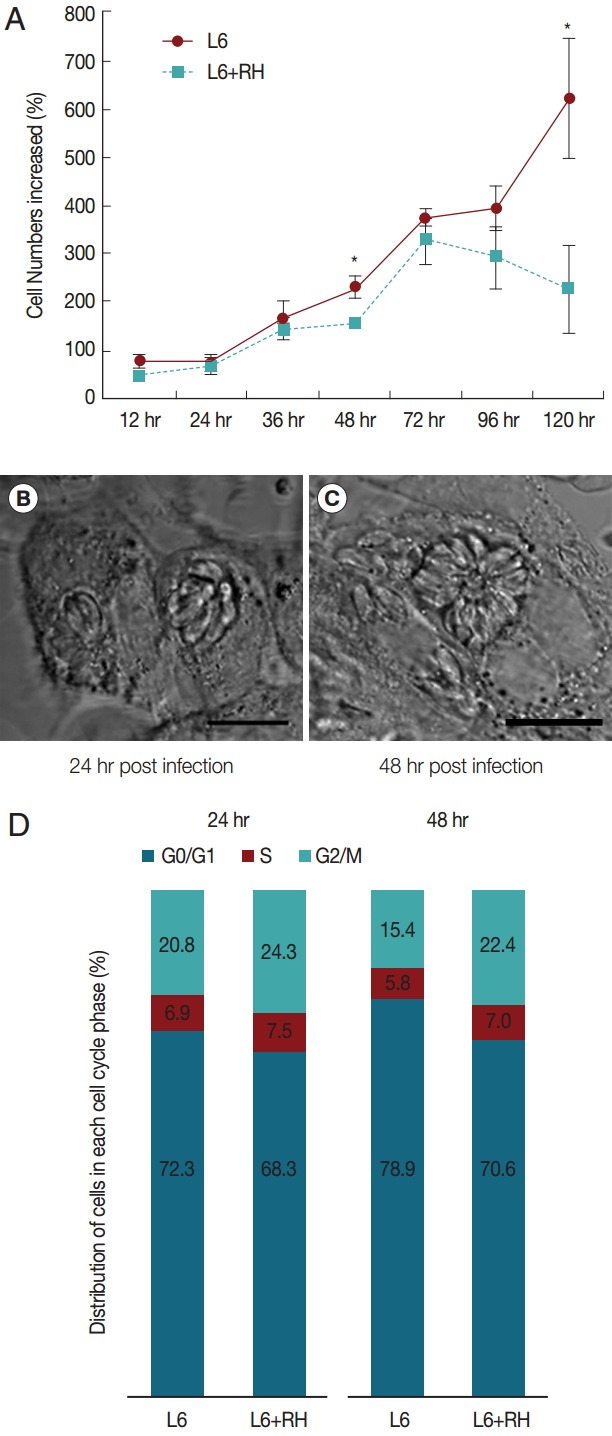
(A) Cell growth patterns of uninfected and T. gondii-infected L6 cells. The cell numbers differed significantly at 48 hr and 120 hr post infection (*P<0.05). (B, C) Phase-contrast images of T. gondii-infected cells at 24 hr and 48 hr post infection (MOI=20), respectively. The images show continuous proliferation of T. gondii in host cells. Bar=10 μm. (D) Cell cycle changes induced by T. gondii infection at 24 hr and 48 hr post infection.