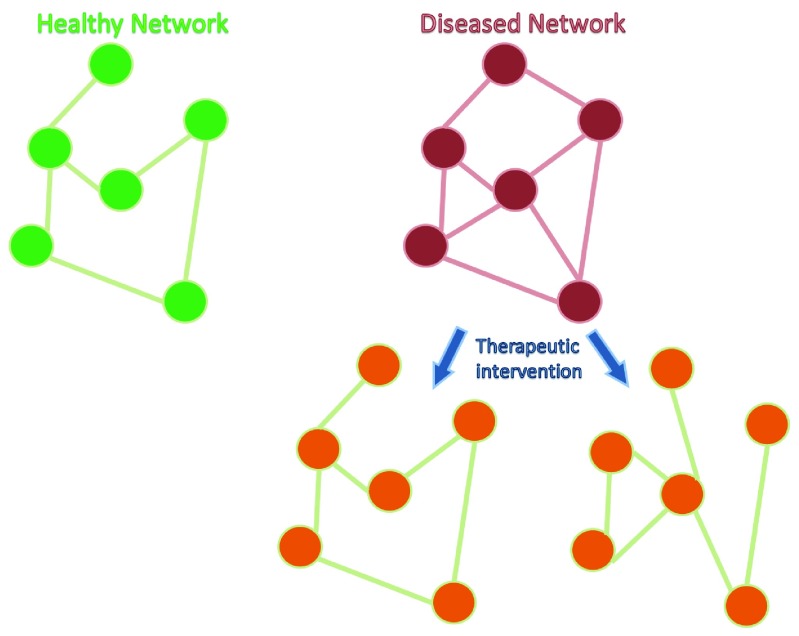
Figure 1. Cartoon representing healthy and diseased networks.
Each node in the network could represent a gene, transcriptional module, single neuron, or brain region. The lines between the nodes represent relevant interactions between the nodes. Conceptually, the structure of the network is different in disease states compared to controls. In this example, the diseased network is over-connected (e.g. hypersynchrony in an epileptic brain). Targeting the network directly using drugs, brain stimulation, cell therapy, or transcranial magnetic stimulation approaches could modify the diseased network in order to allow more normal function. It remains unknown whether restoration of networks to normal (left network post-therapy) or modification to a network with similar phenotype to normal (right network post-therapy) is required. Understanding of these system-level mechanisms could lead to new treatments or optimization of currently used clinical tools, such as deep brain stimulation.

