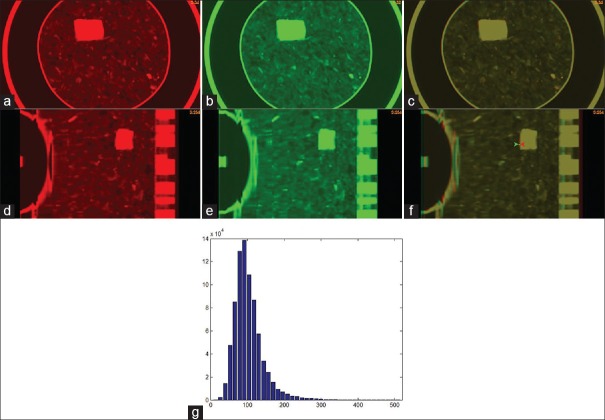
Figure 3.
The axial cut of the end-exhale phase images in (a) the first four-dimensional computed tomography scan, and (b) the second four-dimensional computed tomography scan; (c) the overlay of the two images in (a) and (b); (d-f) the sagittal cuts of the images shown in (a-c); (g) the computed tomography image intensity of the sponge in Pinnacle (X) versus the number of voxels (Y)

