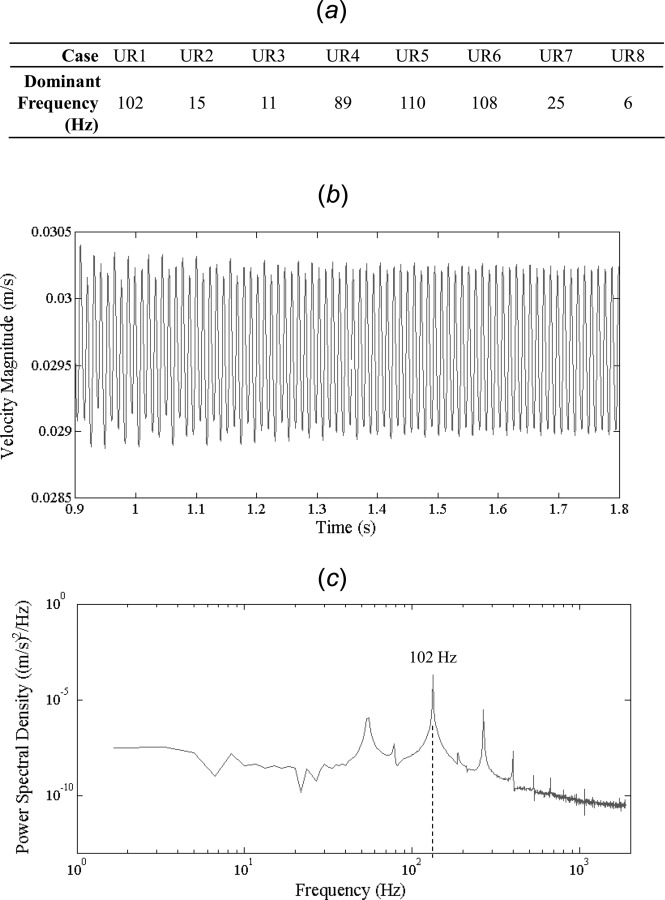
Fig. 7.

The frequency analysis results at a monitoring point in the aneurysm dome. (a) The dominant frequencies in the eight cases with unstable flow. (b) Velocity magnitude versus time at a monitoring point in the aneurysm for the final three periods of a representative case (UR1). (c) Power spectral density (note the log-log scale) of the last three periods for one representative case, UR1. The case shows a dominant frequency of 102 Hz.
