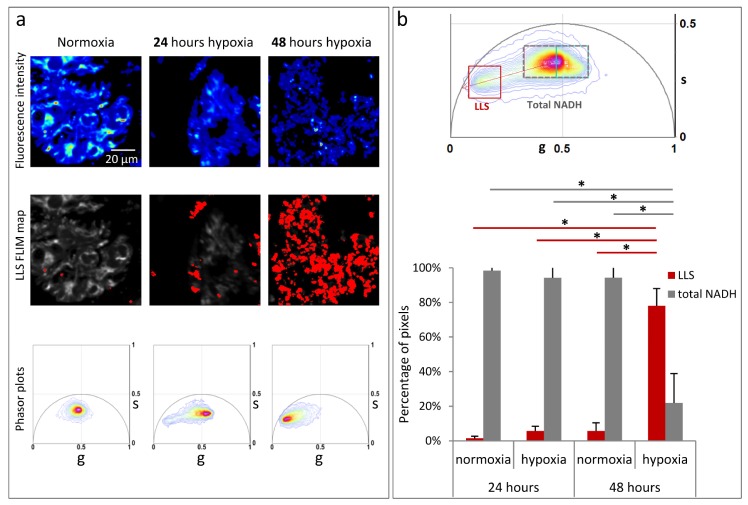
Fig. 3.
Significant increase in the long lifetime species (LLS) with hypoxia. (a) Top row panels shows fluorescent intensity image of hiPS-CM clusters under normoxia, 24 hours hypoxia, 48 hours hypoxia. Middle row panels show LLS FLIM map (in red) created by the LLS window in (b) top panel. Bottom row shows the corresponding individual phasor plots. (b) Top panel is the phasor distribution of 3 three different regions of hiPS-CM clusters, about 10 cells each for normoxia, 24 hours hypoxia, and 48 hours hypoxia conditions. Gray dotted window (‘Total NADH’) selects the total NADH distribution which covers the total area within pink and cyan windows of Fig. 2(b). ‘LLS’ window (red square) selects the LLS phasor distribution. Red dotted arrow indicated the oxidative stress axis. Bottom panel shows quantitative representation of the percentage pixels with lifetime phasors within the ‘Total NADH’ window (gray dotted rectangle) and ‘LLS’ phasor window (red square) of hiPS-CMs under normoxia, 24 hours hypoxia, and 48 hours hypoxia. The error bars shows the standard deviation calculated over average value obtained from each image. Statistical significance was computed by ANOVA with post-hoc Bonferroni correction.

