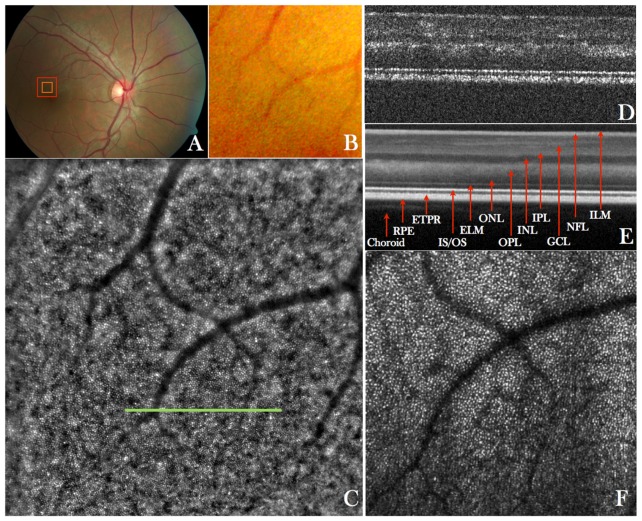
Fig. 2.
A) Wide field (50°x50°) standard fundus image of the retina of a healthy volunteer, B) Enlarged region of interest from the wide field image indicated with the red square in A), C) AO-fundus image (4°x4°) acquired with the new instrument at a location indicated with the red square in A)(temporal = 1°, superior = 2°), D) Single B-scan acquired at a location indicated with the green line in C) and extracted from a volume scan (Visualization 1 (12.7MB, MOV) and Visualization 2 (10.4MB, MOV) ) acquired with the AO-OCT mode at a location indicated with the orange square in A), E) Lateral average (corresponding to 0.25°) of 50 B-scans from the volume scan, F) Extracted en-face image from the AO-OCT volume scan by depth integrating over the photoreceptor bands and squaring of the image to display the image on a linear intensity scale.

