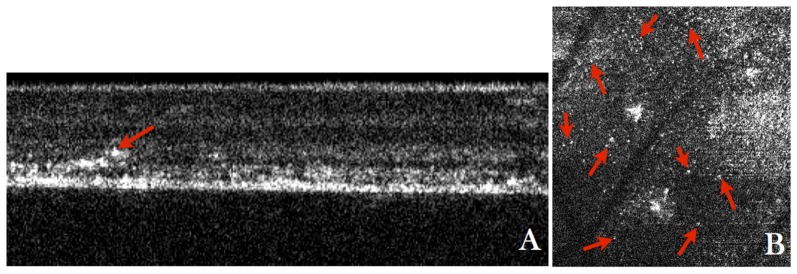
Fig. 5.
A) Frame no. 102 from Visualization 4 (9.7MB, MOV) showing a B-scan where waste deposit within the OPL (indicated with the red arrow) can be observed, B) Frame no. 60 from Visualization 5 (4.8MB, MOV) showing a depth integrated en-face projection over the OPL where tiny spots with a similar size as cone photoreceptors are observed distributed over the entire image (indicated by the red arrows).

