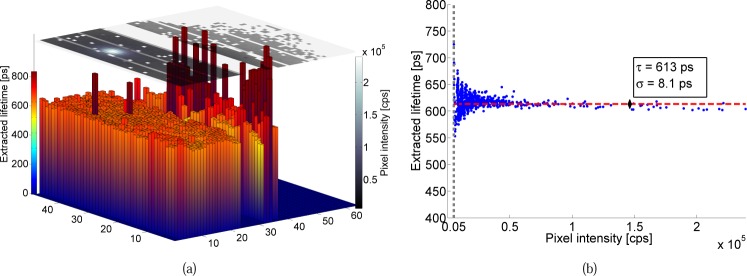
Fig. 7:
Extracted lifetime and intensity for ICG diluted in milk (concentration: 25 µM). (a) Extracted lifetime (3D bars) showing the uniform lifetime extraction ability with respect to the measured pixel intensity (top 2D plane). (b) Scatter plot of the extracted lifetime versus pixel intensity. The lifetime oscillations with intensity are likely due to a sub-optimal optical set-up, which slightly distorted the fluorescence signal. Their effect on the average lifetime is minor.

