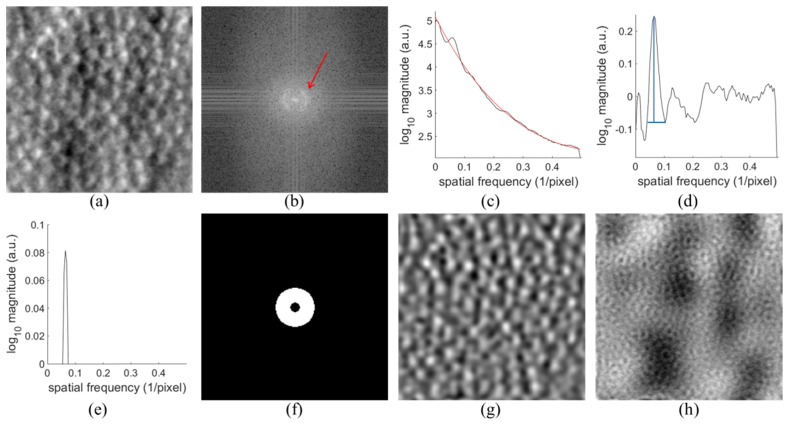
Fig. 3.
Adaptive filtering of split detector AOSLO cone images. (a) Original Image. (b) Discrete Fourier transform of (a) log10 compressed. Red arrow points to Yellott’s ring. (c) Average radial cross section of (b) over 9 sections after filtering in black. Fitted curve in red. (d) Result of subtracting fitted red curve from the black curve in (c). Peak corresponding to cones shown in blue. (e) Upper fourth of peak from (d). (f) Band pass filter in Fourier domain. (g) Filtered original image. (h) Information removed from (a) by filtering.

