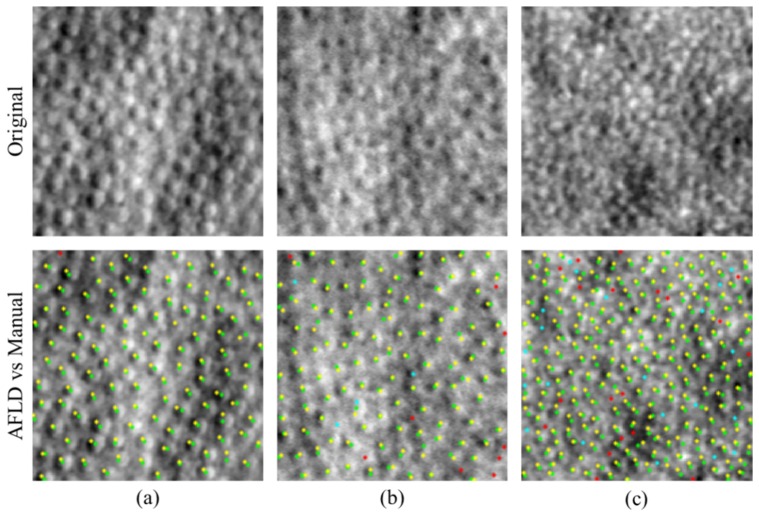
Fig. 6.
Comparison of AFLD marking to the first manual marking on images with varying quality and cone contrast. Original images are shown in the top row. AFLD and manual markings are shown in the bottom row with markings as follows: green (automatic) and yellow (manual) denotes a match; cyan denotes a false negative; and red denotes a false positive. Dice’s coefficients are 0.9957 for (a), 0.9461 for (b), and 0.9123 for (c). Dice’s coefficients are approximately one standard deviation above, at, and one standard deviation below the mean value for the validation set.

