
Fig. 3. Illustration of the image analysis pipeline and resulting spatiotemporal models.
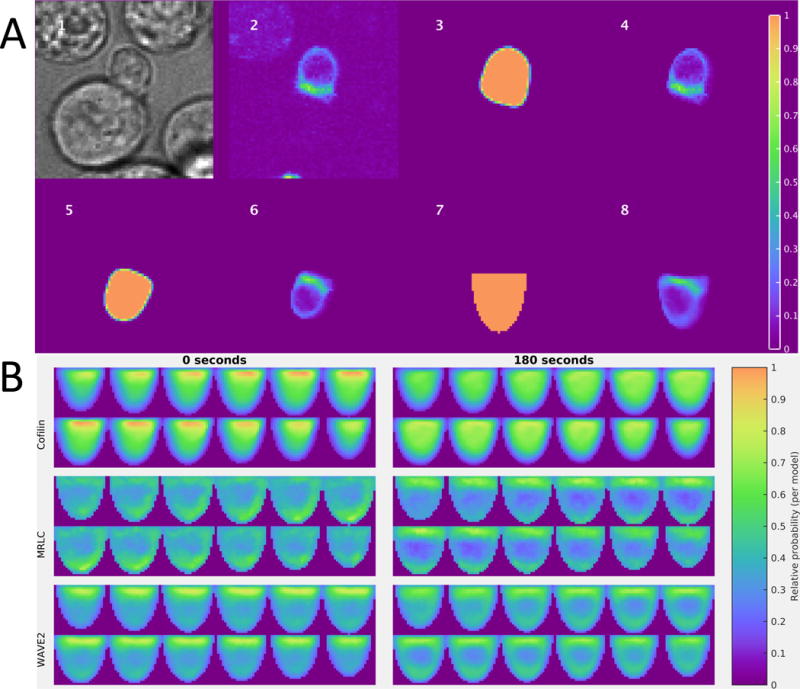
(A) Image 1: Brightfield image centered on a T cell:APC conjugate. Images 2 to 8: Single slices of 3D images that are approximately perpendicular to the immunological synapse, which is shown facing upwards in images 5 to 8. Image 2: False-colored raw coronin-1A–GFP fluorescence image. Image 3: Cell shape extracted by the segmentation algorithm. Image 4: Segmented intensity image. Image 5: Aligned segmentation (immunological synapse facing approximately upwards). Image 6: Aligned segmented intensity image. Image 7: Standard template shape. Image 8: Segmented intensity image deformed into the shape of a standardized cell. (B) Illustrations of spatiotemporal models for cofilin (top), MRLC (middle), and WAVE2 (bottom), which have distinct subcellular distributions at different times. Each panel contains slices perpendicular to the immunological synapse of the full model at 0 (left) or 180 s (right) after synapse formation for each sensor. Within a panel, slices are shown starting at the upper left corner and moving horizontally to the upper right, then wrapping to the lower left corner and continuing to move horizontally towards the lower right; these correspond to z positions from one side to the other relative to the midline of the cell. The models were constructed from 49 to 134 cells from 4 to 7 experiments (see Table S1).