
Fig. 4. Hierarchical clustering of full models constructed for nine sensors under full stimulus and costimulation blockade conditions.
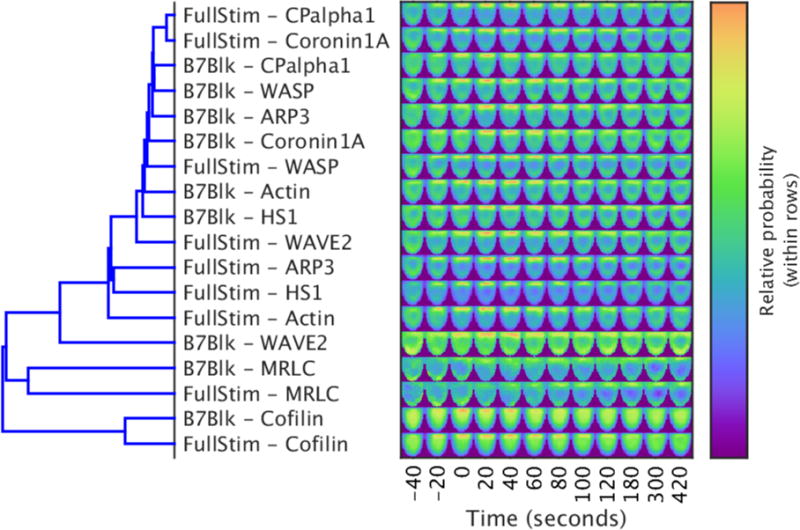
Left: The dendrogram shows xxx. Right: Each image shows a single slice from the 3D model of the distribution of the indicated sensor at the time shown on the horizontal axis. The slices are perpendicular to the synapse and through the middle of the model (the synapse is facing upwards). The cophenetic coefficient of the dendrogram is 0.842. Images are representative of xxx experiments.