
Figure 3. Patterns of Protein Occupancy and Secondary Structure in Specific Nuclear mRNA Regions.
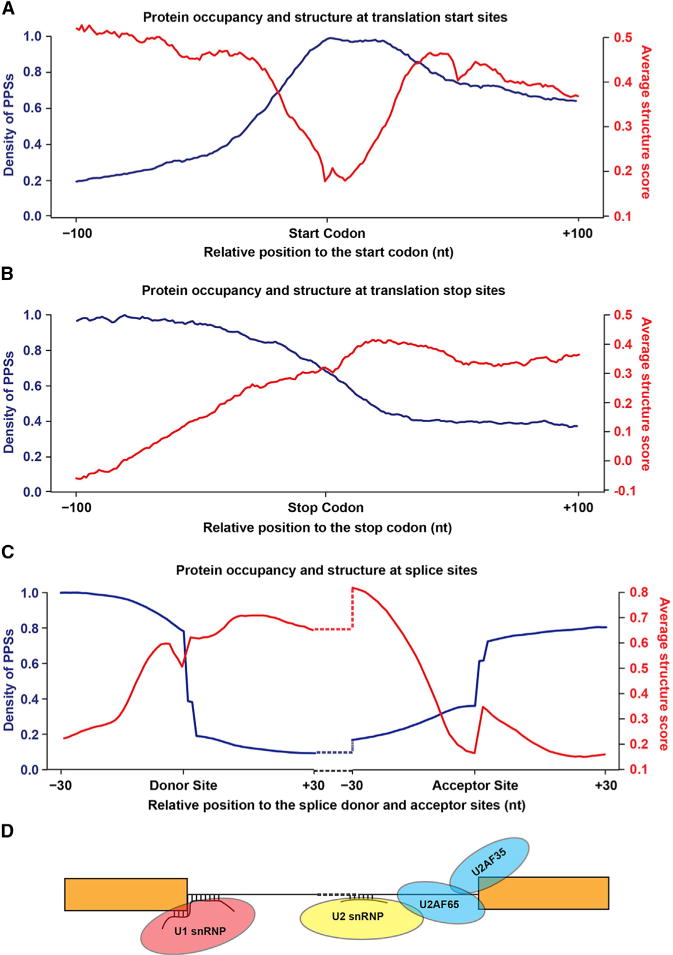
(A and B) PPS density and structure score profiles for nuclear mRNAs based on our PIP-seq experiments. Average PPS density (blue lines) and structure scores (red lines) at each position ± 100 nt from canonical (A) start and (B) stop codons for Arabidopsis nuclear mRNAs.
(C) PPS density and structure score profiles for exon/intron boundaries of nuclear mRNAs. Average PPS density (blue lines) and structure scores (red lines) at each position ± 30 nt from splice donor and acceptor sites.
(D) Model depicting the canonical protein and RNA interactions of the U2-type spliceosome at the splice donor and acceptor sites depicted in (C). See also Figure S5.