
Figure 5. The Landscape of Protein-Bound RNA Motifs.
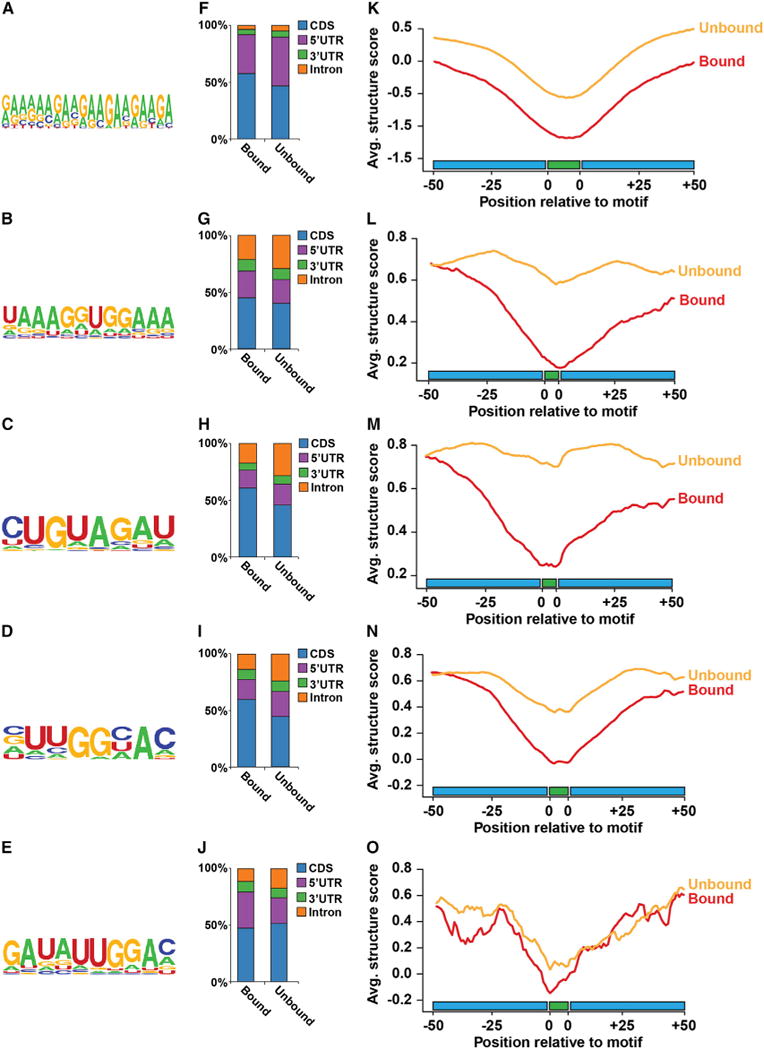
(A–E) Overrepresented sequence motifs identified by MEME (A) or HOMER (B–E) analysis of PPS sequences.
(F–J) The relative distribution of protein-bound and unbound motifs from (A) to (E) throughout specific pre-mRNA regions, including the CDS (blue), 5′ UTR (purple), 3′ UTR (green), and intron (orange).
(K–O) Structure score profiles at RBP-binding motifs from (A) to (E). Average structure score at each position ± 50 nt up- and downstream of bound (red lines) and unbound (orange lines) motif occurrences from (A) to (E).