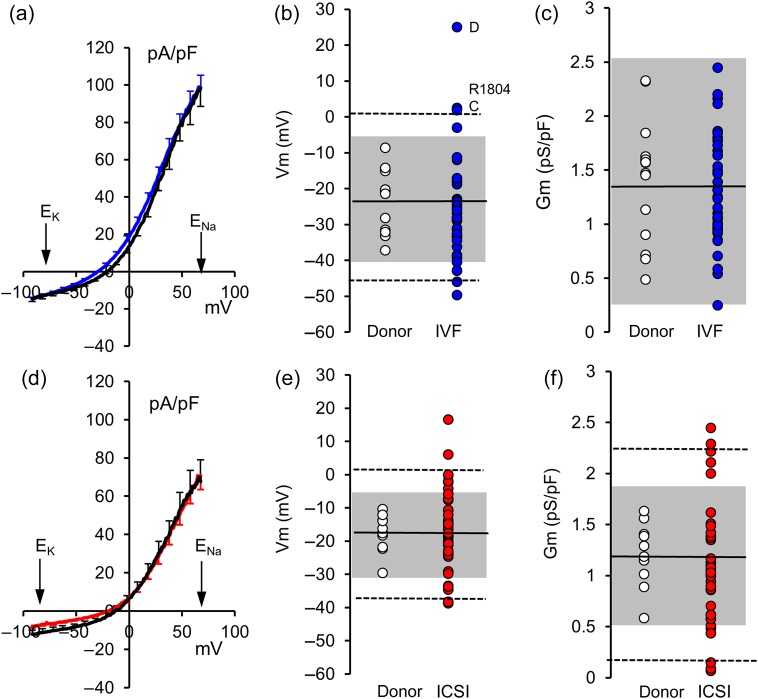
Figure 1.
(a) Mean ramp-induced I–V relationship for IVF patients (blue; n = 40 patients) and control donor samples prepared under the same (capacitating) conditions (black; n = 16 donors). Error bars show ±1 SEM. Distribution of Vm (b) and Gm (c) for IVF patients (blue symbols; n = 40) and donor samples prepared under the same (capacitating) conditions (open symbols; n = 16). Black line shows donor mean, dashed lines and grey shading show 99 and 95% limits for two-tailed T-distribution of donor samples. Labelled points show patients illustrated in Fig. 3a and c. (d) Mean ramp-induced I–V relationship for ICSI patients (red; n = 41 patients) and donor control samples prepared under similar (non-capacitating) conditions (black; n = 10 donors). Error bars show ±1 SEM. (e and f) Distribution of values of Vm and Gm, respectively, for ICSI patients (red symbols; n = 41 patients) and donor samples prepared under similar (non-capacitating) conditions (open symbols; n = 10 donors). Black line shows donor mean, dashed lines and grey shading show 99 and 95% limits for two-tailed T-distribution of donor samples.

